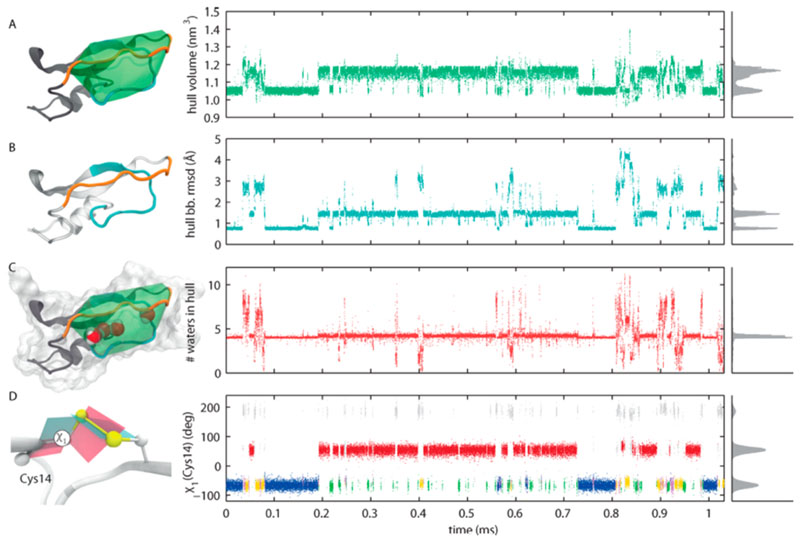
Figure 2.
Fluctuations in the interloop region during 1 ms. (A) Volume of the convex hull spanning the four internal hydration sites. (B) Backbone RMSD, relative to crystal structure 5pti, for the residues defining the hull. (C) Number of water molecules inside the hull. (D) Dihedral angle χ1(C14), with disulfide isomeric states color-coded: M1 (blue), M2 (magenta), M3 (yellow), mC14 (red), mC38 (green), and other (gray). The time series values plotted here are either averaged over consecutive 25 ns windows (A–C) or sampled with 25 ns resolution (D). The full-trajectory distributions are projected on the right-hand axis. This figure is reprinted from ref 51. Copyright 2013 American Chemical Society.

