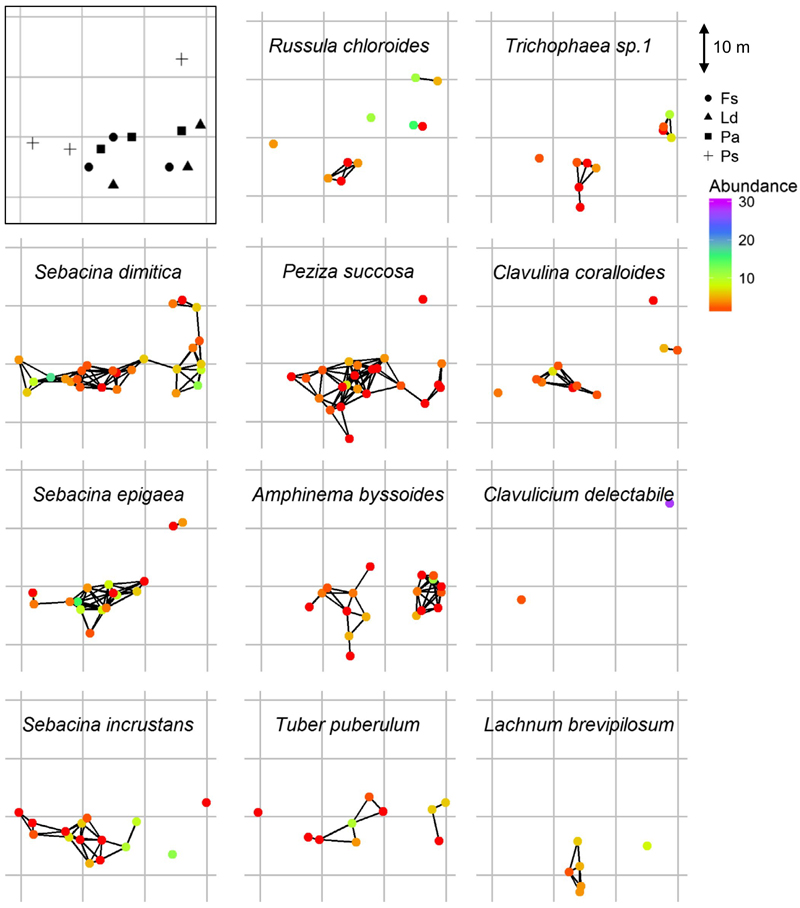
Figure 4.
Predicted spatial EMF networks for the most abundant 11 OTUs in the mixed forest plot near Basel, Switzerland. Black frame (top left) represent schematic presentation of the distribution of the four tree species in the mixed forest plot. Colours indicate the species abundance at each location. Lines connect locations where an EMF species was identified 6 m or less from the nearby location. The 6 m threshold is based on the distance dependence of observed isotopic carbon transfer for the studied trees on site (Mildner et al., 2014)

