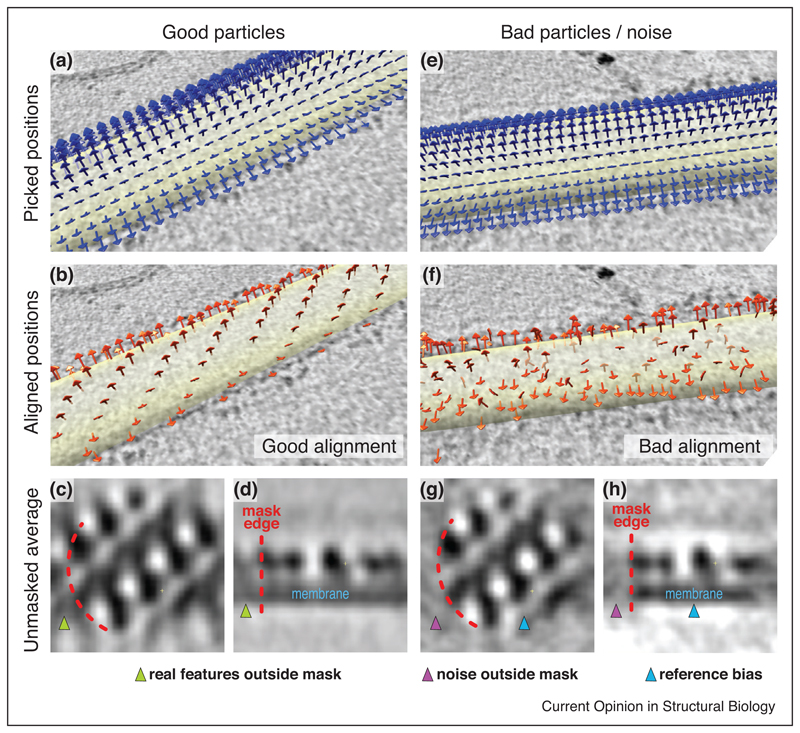
Figure 3.
Example of validation in StA from COPII-coated tubules data [22••]. COPII forms a pseudo-helical lattice. (a) Arrows indicate the initial coordinates and orientations for particle picking on a coated tubule, where subvolume centres and sizes are chosen to oversample the tube surface, and rough orientations are assigned based on the underlying tubular geometry. (b) Coordinates after subtomogram alignment. The centres have shifted and form a clearly recognisable pseudo-helical pattern, validating the alignment. (c,d) Top and side cross-section of the average, respectively, obtained after alignments of subtomograms using a lattice-shaped starting reference and a mask (partially outlined in orange). The protein and membrane densities clearly continue outside the mask, validating the alignment. (e-h) As in (a-d), but on a tube where no ordered lattice was present. The pseudo-helical lattice is not apparent in (f), and in (g) and (h) the mask edge defines a sharp drop of the electron density, indicating that the average obtained mostly reflects reference bias.

