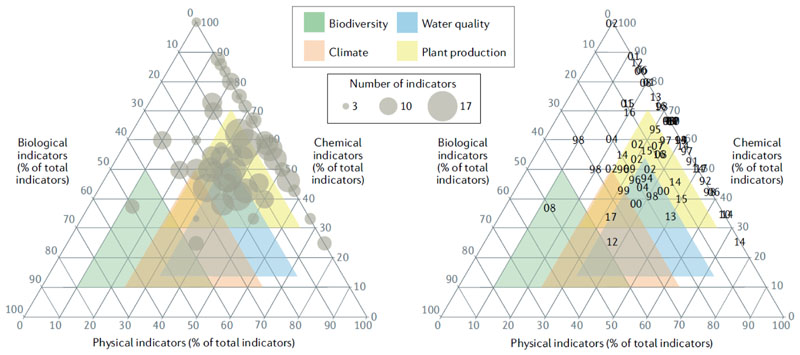
Figure 5. Biological, chemical and physical indicators included in soil health assessment schemes6 .
a| Number of indicators and proportion of each type (biological, chemical or physical). Size of the circle represents the number of indicators in the assessment scheme. b| Year of each soil health assessment scheme. Only the last two digits of the year are shown (values in the 80’s and 90’s are from the 1980s and 1990s, values from 00 to 20 represent years 2000 onwards). Currently proposed soil health indices utilize mostly chemical and physical indicators. The proportion of biological indicators is typically lower than either chemical or physical indicators, which did not change over time as the methods were published, likely reflecting the historic focus of soil health indices on crop growth. The number of indicators in the proposed schemes does not relate to the proportion of biological indicators. A comprehensive soil health index may consider a balanced set of indicators that represent at least 20% biological, physical and chemical measurements (dashed red triangle). However, indices designed to quantify different services may require a different set of indicators: a soil health index for crops may require more chemical indicators (inside the yellow ‘Plant’ triangle), for water more physical (blue triangle), for biodiversity more biological (green triangle), and for climate more physical and biological indicators (orange triangle).

