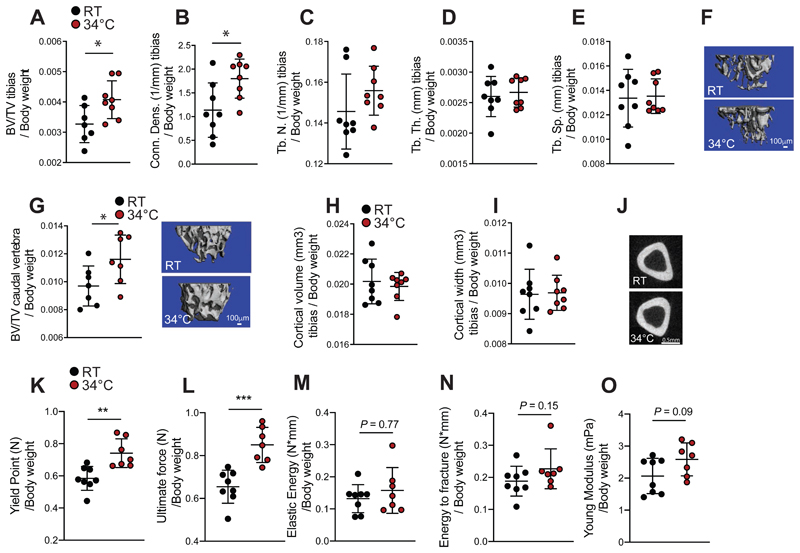
Figure 1. Warmth Exposure Improves Bone Strength during Adulthood.
(A-F) Trabecular bone microarchitecture of tibias showing bone volume/total volume (BV/TV) (A), connectivity density (Conn. Dens) (B), number of trabeculae (Tb. N) (C), trabecular thickness (Tb.Th.) (D) and trabecular separation (Tb.Sp) (E) of 24 week-old female mice exposed to 34°C for 2 month prior sacrifice and their RT controls (n = 8 per group), all normalized to body weight.
(F) Representative reconstruction of trabecular bone used for the calculations in A-F. Scale = 100μm. Each trabecular reconstruction was done by scanning and compiling 262 sections from the beginning of the growth plate to the midshaft in each mouse using n = 8 per group.
(G-I) Cortical bone volume (G) and width (H) of mice as in (A), measured in midshaft of the tibias and normalized to body weight. (G right) Representative reconstruction (each consisting of 262 sections, n = 8 per group) of trabecular bone used for calculation. Scale = 100μm. (I) Representative cortical section (from 62 sections per bone of each mouse of n = 8 per group). Scale: 0.5mm.
(J) Bone volume/total volume (BV/TV) (left), measured in the caudal vertebra (CA2) (normalized to body weight) of mice as in (A).
(K-O) Biomechanical analysis of femur from mice as in (A) using a 3-point bending test. The parameters measured include the yield point (K), the ultimate force (L), the elastic energy (M), the energy to fracture (N) and the Young’s modulus (O) and normalized to their respected body weight.
Data are shown as mean ± SD (n = 8 per group). Significance (P value) is calculated using Mann-Whitney t-test *P < 0.05; **P < 0.01; ***P < 0.001.

