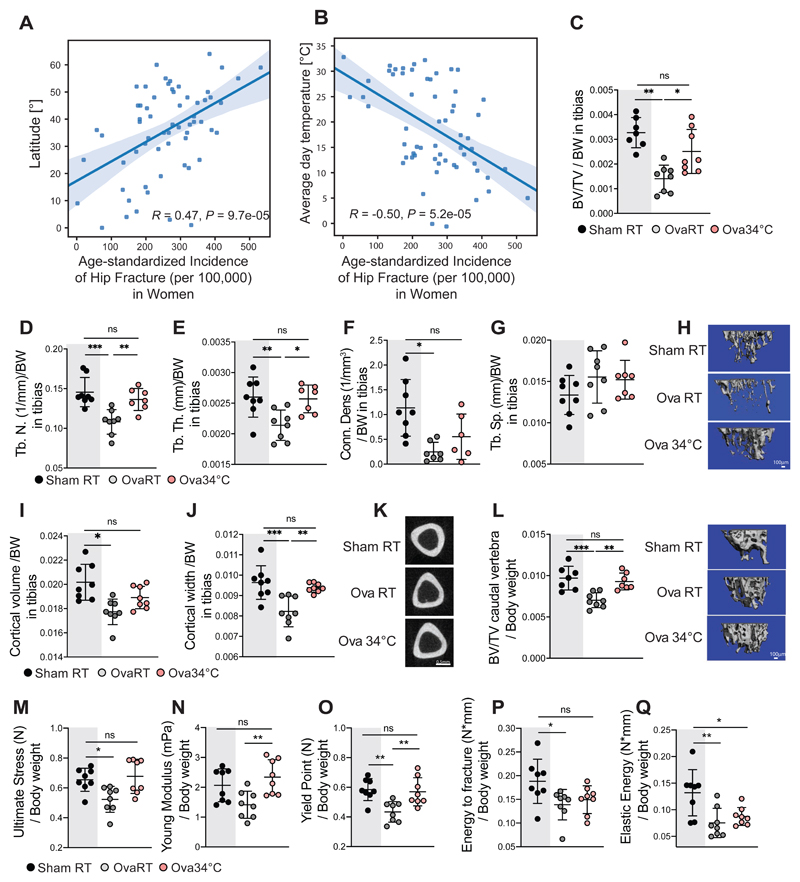
Figure 2. Warmth Exposure Protects Against Osteoporosis.
(A and B) Metadata analysis showing age-standardized correlation between hip fracture incidence (per 100’000 inhabitants) in women per country, versus the latitude of the country’s capitals (A), or versus the country’s average day temperature (B).
(C-H) Trabecular bone microarchitecture of tibias in female mice that were ovariectomized, or sham-operated at 16 weeks of age, and then exposed to 34°C for 2 months (Ova34°C, or Sham34°C, respectively), or kept at RT (OvaRT, or ShamRT). Bone volume/total volume (BV/TV) (C), the number of trabeculae (Tb. N) (D), the trabecular thickness (Tb.Th.) (E), the connectivity density (Conn. Dens) (F), and the trabecular separation (Tb.Sp) (G) from the mice as in (C) at the end of the warm exposure, normalized to their respective body weight. (H) Representative reconstruction (each consisting of 262 sections, n = 8 per group) of trabecular bone used for calculations. Scale: 100μm.
(I-K) Cortical bone volume (I) and width (J) of mice as in (C) measured in the midshaft of the tibias and normalized to the body weight. (K) Representative cortical sections from each group (from 62 sections per bone of each mouse of n = 8 per group). Scale: 0.5mm.
(L) Trabecular bone volume/tissue volume (BV/TV), measured in the caudal vertebra (CA2) (normalized to body weight) of mice as in (C). Right, representative reconstruction (each consisting of 262 sections, n = 8 per group) of a vertebra used for calculation. Scale: 100μm (M-Q) Biomechanical analysis of femur from mice as in (C) showing ultimate stress (M), Young’s modulus (N), yield point (O), energy to fracture (P) and elastic energy (Q), all normalized to the body weight.
Data are shown as mean ± SD (n = 8 per group). Significance (P value) is calculated using Mann-Whitney t-test: *P < 0.05; **P < 0.01; ***P < 0.001. Sham RT mice (as shown in Figure 1) are shadowed in grey.

