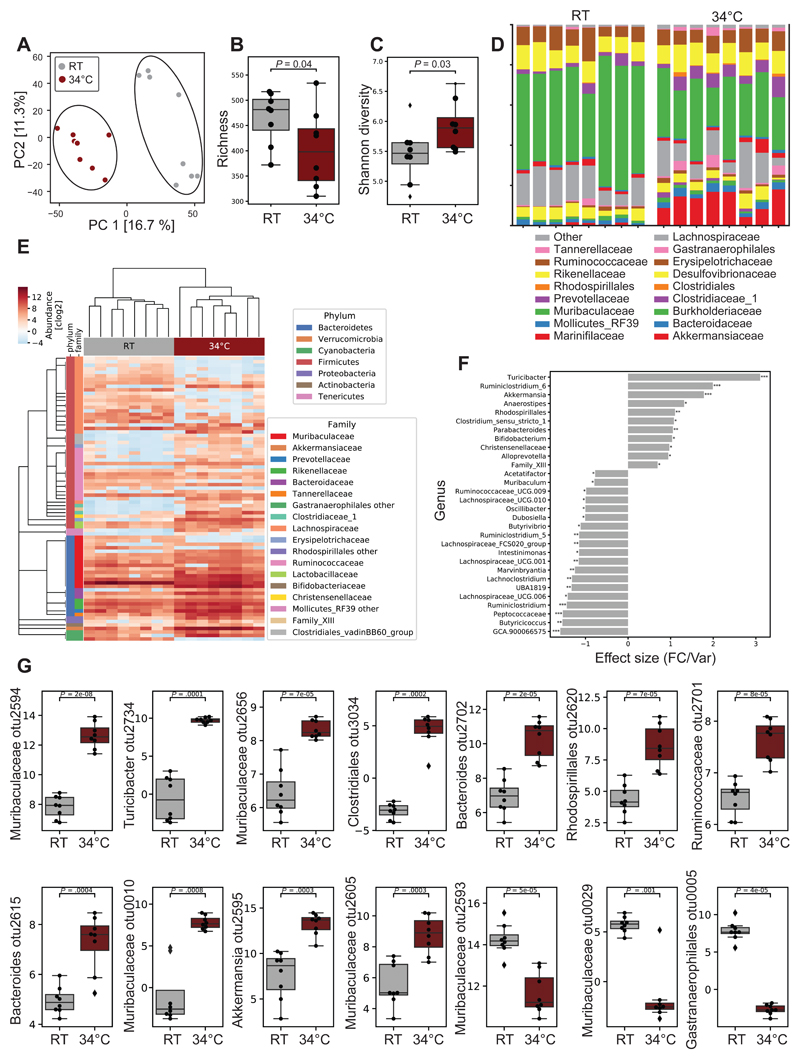
Figure 3. Warmth Exposure Changes the Gut Microbiota Composition.
(A) Principal component analysis (PCA) of 16S rDNA sequencing of fecal microbiota from 24 weeks old female mice exposed for 2 months to 34°C, or kept at RT. Each dot represents a fecal microbiota from one mouse. The analysis is based on the centric log2 ratio (CLR).
(B and C) Estimated richness (B) and Shannon diversity (C) of microbiota samples as in (A).
(D) Bar chart of the relative microbiome abundance at family level from mice as in (A).
(E) Hierarchical clustering associated with a heatmap comparing the CLRs of the OTUs selected for a P < 0.05 of mice as in (A). An idealized tree represents their taxonomic hierarchy down to genus level associated with bars that are color-coded for phylum and family. Each column represents one mouse.
(F) Effect size of all significantly changed genera calculated with aldex2 (FDR<0.05) in samples from mice as in (A).
(G) CLRs representing relative abundance of the most changed OTUs (FDR<0.01) by warm exposure in samples from mice as in (A). Boxplots represent median and quantiles; the whiskers show 1.5 inter quartile range and values outside the whisker’s box are represented as diamonds. Data are shown as mean ± SD (n = 8 per group). Significance in (F) and (G) is calculated using Welch t-test: *P < 0.05; **P < 0.01; ***P < 0.001.

