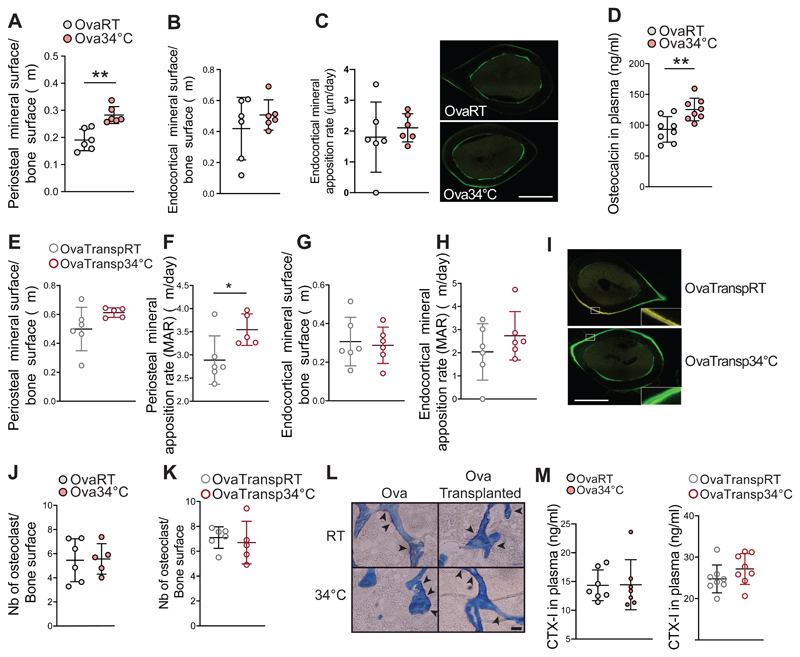
Figure 6. Warmth and Warm–Microbiota Transplantation Increase Periosteal Bone Formation.
(A-C) Periosteal (A) and endocortical (B) mineralized surface after calcein injection in 24 weeks old female mice that were ovariectomized at 16 weeks of age and exposed for 2 months to 34°C, or kept at RT. (C) Representative images (of n = 6) of fluorescent calcein in femur midshaft used for the quantifications.
(D) Osteocalcin levels in plasma of mice as in (A).
(E-I) Periosteal mineralized surface (E), periosteal mineral apposition rate (MAR) (F), endocortical mineralized surface (G), and endocortical MAR (H) in tibias of 21 weeks old ovariectomized, microbiota recipient female mice (OvaTransp34°C, or OvaTranspRT) as in Figure 4A-E (I) Representative images (of n = 6) of fluorescent calcein in femur midshaft used for the quantifications. Scale: 0.5mm.
(J-L) Tartrate-resistant acid phosphatase (TRAP) staining quantification of osteoclast number in femur trabeculae of mice as in (A) shown in panel (J), and of mice as in (E) shown in panel (K). (L) Representative images (of n = 6) of the quantifications shown in (J) and (K). Arrowheads correspond to the TRAP signal. Scale: 50μm.
(M) CTX-1 levels in plasma of mice as in (J) and (K).
Data are shown as mean ± SD (n = 6 per group). Significance (p-value) is calculated using Mann-Whitney t-test: *P < 0.05; **P < 0.01; ***P < 0.001.

