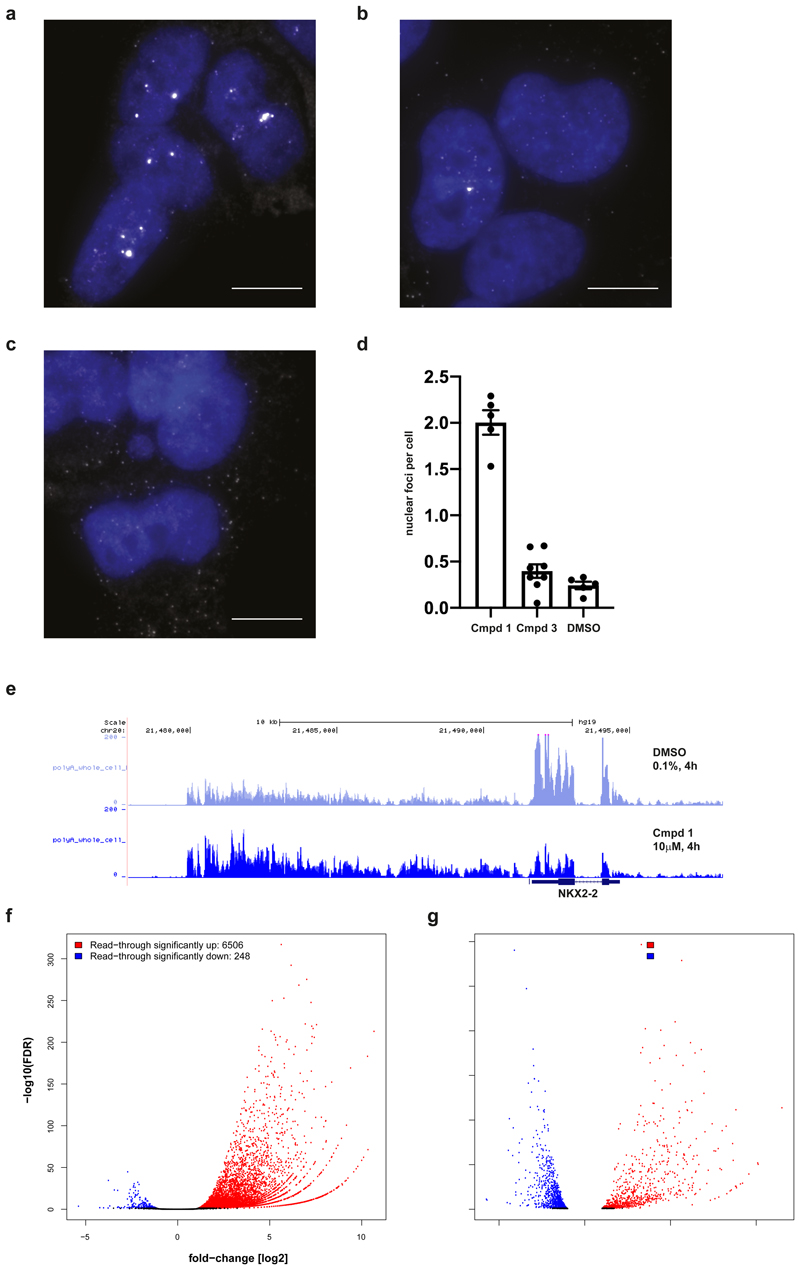
Figure 4. Compound 1 induces transcript accumulation and RNA Pol II read-through.
a,b,c, Images of A-673 cells that were treated with compound 1 (a), compound 3 (b) or DMSO (c) for 4 h prior to fixation and probed for NKX2-2 mRNAs (white) using FISH probes targeted to the coding sequence of the transcript. Nuclei (blue) were stained with DAPI. Images are representative from three independent experiments performed in duplicate. Scale bar = 10 μm. d, Compound 1 (79 cells) resulted in the formation of bright nuclear foci that contained multiple NKX2-2 transcripts (p-value < 0.0001, unpaired two-tailed t test) while transcripts in cells treated with compound 3 (40 cells) were similar to cells treated with DMSO (59 cells) (p-value=0.15, unpaired two-tailed t test). Data are presented as mean plus/minus standard error of the mean (error bars) for nuclear foci counted in each experiment. e, RNA-seq traces at NKX2-2 locus (hg19, chr20:21,477,893-21,498,177) generated from A-673 cells that were treated with 1 or DMSO for 4 h prior to whole cell lysis and RNA purification. Three biological replicates per condition merged into one trace. f,g, RNA-seq based quantification of (f) read-through expression genome-wide and of (g) changes in global gene expression, both in A-673 cells upon 4 h treatment with 1 versus DMSO, analyzing RNA purified from whole cell extracts of three biological replicates. Normalized read counts were analyzed using a negative binomial generalized log-linear model with two-sided comparisons and false discovery rate controlled using Benjamin & Hochberg multiple comparisons adjustment via edgeR. Significance cut-offs defined as absolute value fold-change [log2] > 1 and adjusted p-val/FDR < 0.05, and marked in blue (down) or red (up).

