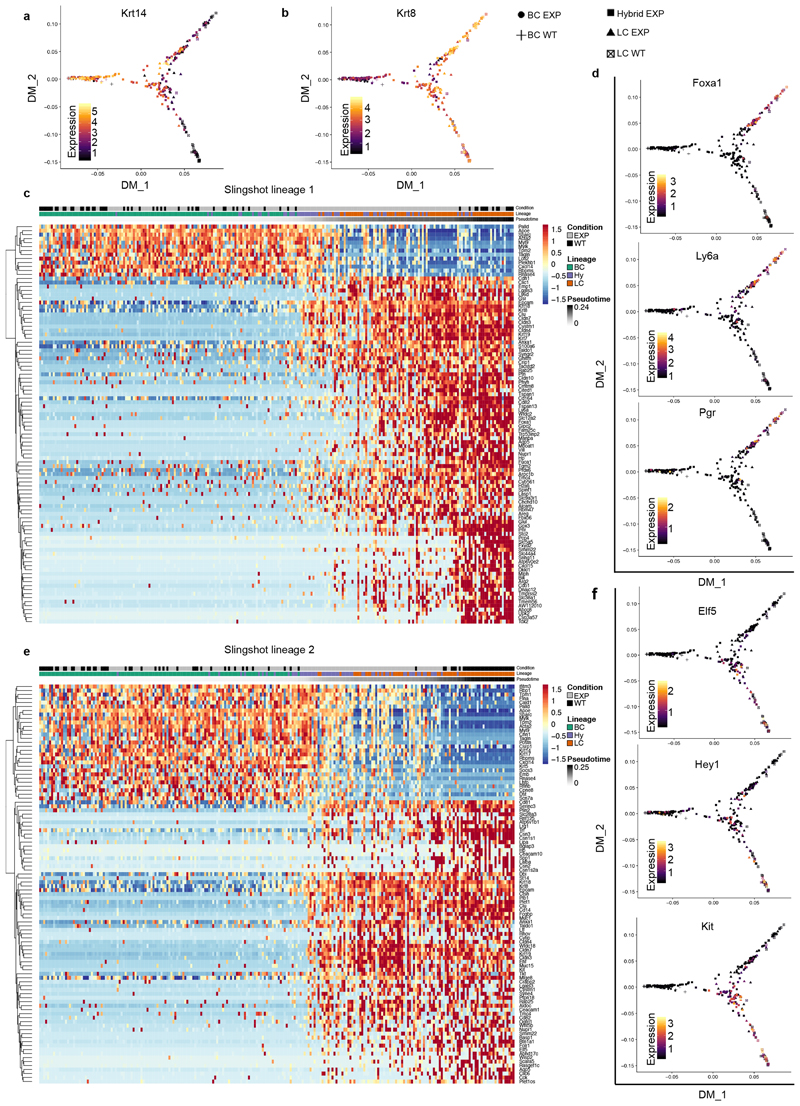
Extended Data Fig. 7. Lineage trajectory inference using Slingshot.
a, b, Diffusion maps showing normalized expression of Krt14 (a, BC) and Krt8 (b, LC). c, Heat map representing the top 100 most significant (lowest adjusted P value) genes differentially expressed along trajectory 1 (n = 337 cells). FDR-corrected P values from F-test on Loess-term for pseudotime in the GAM fit. d, Diffusion maps showing normalized expression of markers for ER+ LC (Foxa1, Ly6a/Sca1 and Pgr). e, Heat map representing the top 100 most significant (lowest adjusted P value) genes differentially expressed along trajectory 2 (n = 337 cells). FDR-corrected P values from F-test on Loess-term for pseudotime in the GAM fit. f, Diffusion maps showing normalized expression of markers for ER- LC (Elf5, Hey1 and Kit). For the diffusion maps the colour bars represent normalized expression levels, going from black (low expression) to yellow (high expression). For the heat maps rows represent the genes, ordered by hierarchical clustering. Colours correspond to the Z-score scaled expression of a gene. Columns represent cells, which are ordered by their pseudotime value in the respective trajectory and their types (BC, hybrid or LC) in control or experimental condition (wild-type or EXP) are indicated at the top of the heat map.

