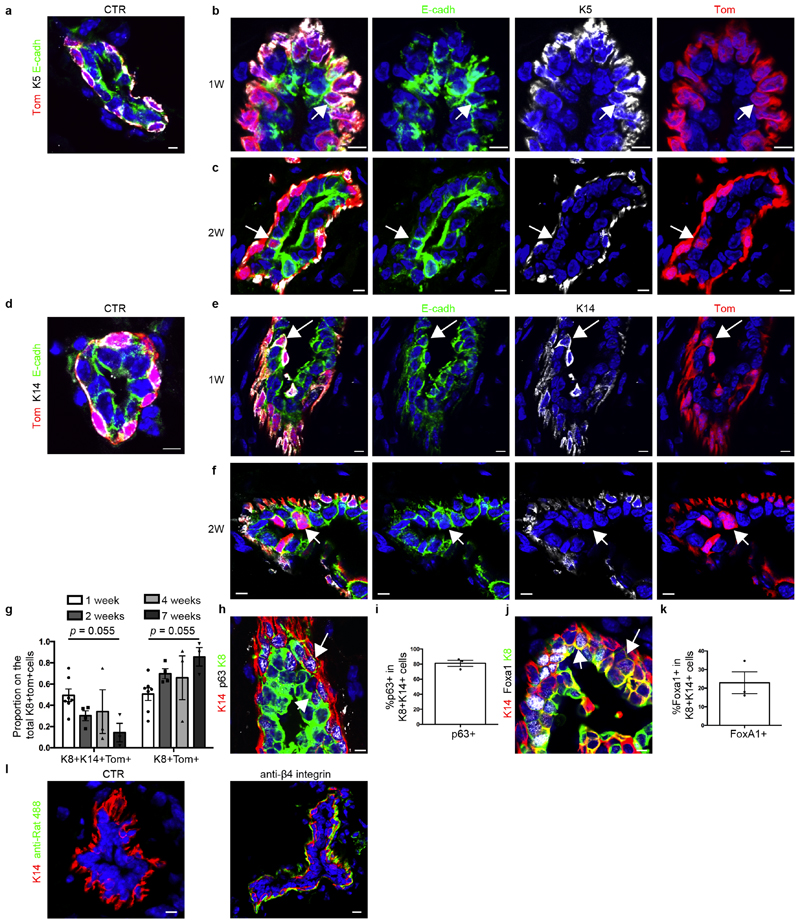
Extended Data Fig. 8. Immunostaining of basal and luminal markers after LC ablation and antibody permeability.
a–f, Confocal imaging of immunostaining for E-cadherin, K5 and tdTomato (a–c) or E-cadherin, K14 and tdTomato (d–f) in CTR (a, d) or K5CreER/tdTomato/K8rtTA/TetO-DTA mice after IDI of DOX and chased for 1 week (b, e) or 2 weeks (c, f) (n = 3 mice per condition). g, Quantification of the proportion of hybrid K8+ K14+tdTomato+ cells and K8+tdTomato+ cells on the total K8+tdTomato+ cells at 1 week (n = 7 mice), 2 weeks (n = 4 mice), 4 weeks (n = 3 mice) and 7 weeks (n = 3 mice) after DOX treatment. The P value between 1 week and 7 weeks, derived from ANOVA followed by two-sided Dunnett’s test, is shown. h, i, Confocal imaging of immunostaining for K14, p63 and K8 (h) and quantification of p63+ cells in K8+ K14+ cells (i) in CTR or K5CreER/tdTomato/K8rtTA/TetO-DTA mice after DOX IDI and chased for 1 week. n = 3 mice per condition. j, k, Confocal imaging of immunostaining for K14, Foxa1 and K8 (j) and quantification of Foxa1+ cells in K8+ K14+ cells (k) in CTR or K5CreER/tdTomato/K8rtTA/TetO-DTA mice after DOX IDI and chased for 1 week. n = 3 mice per condition. l, Confocal imaging of immunostaining for K14 and anti-rat Alexa Fluor 488 (green) in CTR MG not injected or MG after IDI of rat anti-β4 integrin (CD104) and chased for 2 days. n = 3 mice per condition. Data are mean ± s.e.m. For the immunofluorescence data, Hoechst nuclear staining is shown in blue. Scale bars, 5 μm.

