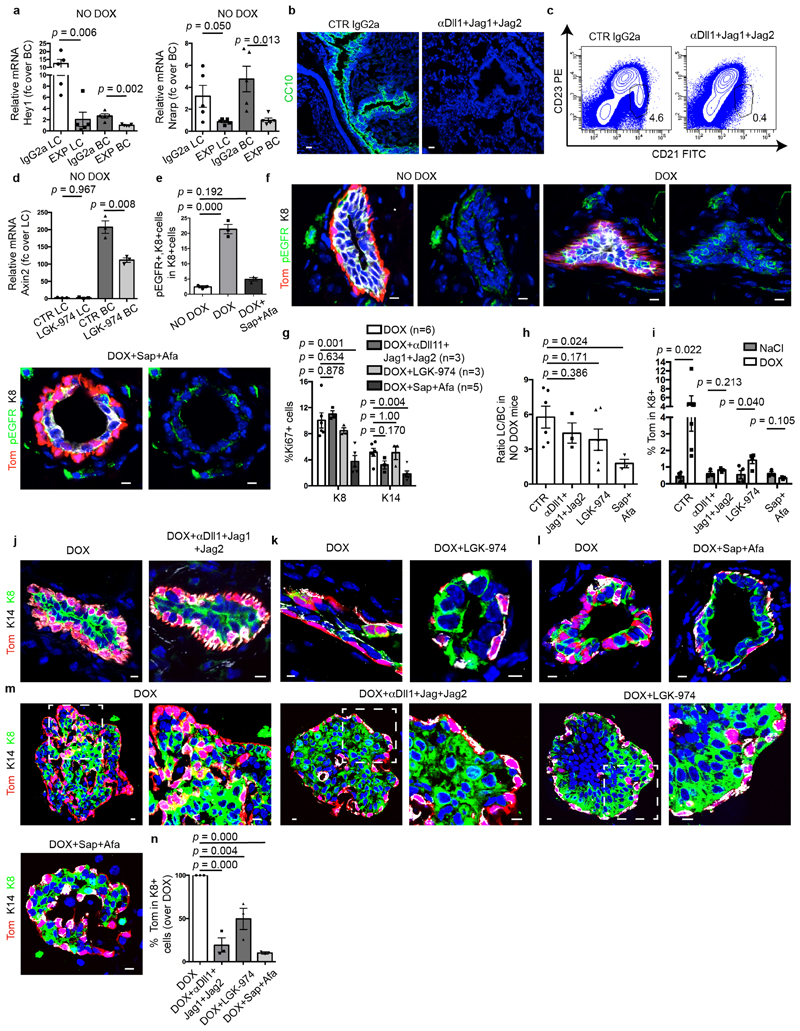
Extended Data Fig. 10. Effect of administration of anti Dll1, Jag1 and Jag2 blocking antibodies; LGK-974; sapitinib and afatinib on MG and MG organoids.
a, qRT–PCR analysis of Notch target gene Hey1 and Nrarp of FACS-isolated LCs and BCs of K5CreER/tdTomato/K8rtTA/TetO-DTA mice treated with IgG2a (CTR Ab) or anti-Dll1, Jag1, Jag2 blocking antibodies (n = 5 mice per condition), showing the efficient inhibition of Notch target genes after blocking antibody administration. P values are derived from unpaired two-sided t-tests. b, Immunostaining for CC10 in lung sections of K5CreER/tdTomato/K8rtTA/TetO-DTA mice treated with CTR IgG2a or anti-Dll1, Jag1 and Jag2 blocking antibodies, showing the disappearance of the goblet cells demonstrating the efficiency of Notch inhibition (n = 3 mice per condition). c, Representative FACS plot of CD21/CD23 in CD45+ CD5− spleen cells in mice treated with CTR IgG2a or anti-Dll1, Jag1 and Jag2 blocking antibodies showing the disappearance of the marginal zone B cells (CD21high CD23−) demonstrating the efficiency of Notch inhibition (n = 3 mice per condition). d, qRT–PCR analysis of Wnt target gene Axin2 of FACS-isolated LCs and BCs of K5CreER/tdTomato/K8rtTA/TetO-DTA CTR mice or treated with LGK-974, showing the efficient inhibition of Wnt target genes by LGK-974 (n = 3 mice per condition). P values are derived from unpaired two-sided t-tests. e, f, Confocal imaging (e) and quantification (f) of immunostaining for tdTomato, phospho-EGFR (p-EGFR) and K8 in CTR and K5CreER/tdTomato/K8rtTA/TetO-DTA MG after DOX IDI and chased for 1 week and mice after DOX IDI and treated with sapitinib (Sap) and afatinib (Afa) and chased for 1 week (n = 3 mice per condition). P values are derived from ANOVA followed by two-sided Dunnett’s tests. g, Quantification of the expression of Ki67 in MG after IDI of DOX in the absence or in the presence of different inhibitors. The number of independent mice analysed is shown in parentheses. P values are derived from ANOVA followed by two-sided Dunnett’s test. h, FACS analysis of the LC/BC ratio of MG in control mice (n = 6 mice); mice treated with anti-Notch ligand antibodies (n = 3 mice); with LGK-974 (n = 4 mice) and anti-ErbB inhibitors (n = 3 mice) for 9 days showing that the inhibition of Notch or Wnt signalling does not affect the ratio between LCs and BCs whereas Erbb inhibitors decreased the proportion of LCs. P values are derived from ANOVA followed by two-sided Dunnett’s test. i, FACS analysis of MG showing tdTomato+ cells in LCs after NaCl IDI (n = 4 mice); DOX IDI (n = 5 mice); NaCl or DOX IDI and anti-Notch ligand antibodies (n = 3 mice); NaCl or DOX IDI and Wnt inhibitor (n = 4 mice); NaCl or DOX IDI and anti-ErbB inhibitors (n = 3 mice); for 9 days. P values are derived from unpaired two-sided t-tests. j–m, Confocal imaging of immunostaining for tdTomato, K8 and K14 of MG (j–l) and organoids (m) after DOX or DOX+anti-Notch ligand antibodies (j); DOX+Wnt inhibitor (k); DOX+sapitinib/afatinib (l). n, Quantification of the expression of tdTomato in K8+ cells in MG organoids treated with DOX, DOX+anti-Notch ligand antibodies, DOX+LGK-974 or DOX+sapitinib/afatinib for 48 h and chased for 10 days with media and the corresponding inhibitor. Data are normalized over DOX. For m, n, n = 3 independent experiments. Data are mean ± s.e.m. P values are derived from ANOVA followed by two-sided Dunnett’s test. Data are mean ± s.e.m. For the immunofluorescence data, Hoechst nuclear staining is shown in blue. Scale bars, 5 μm.

