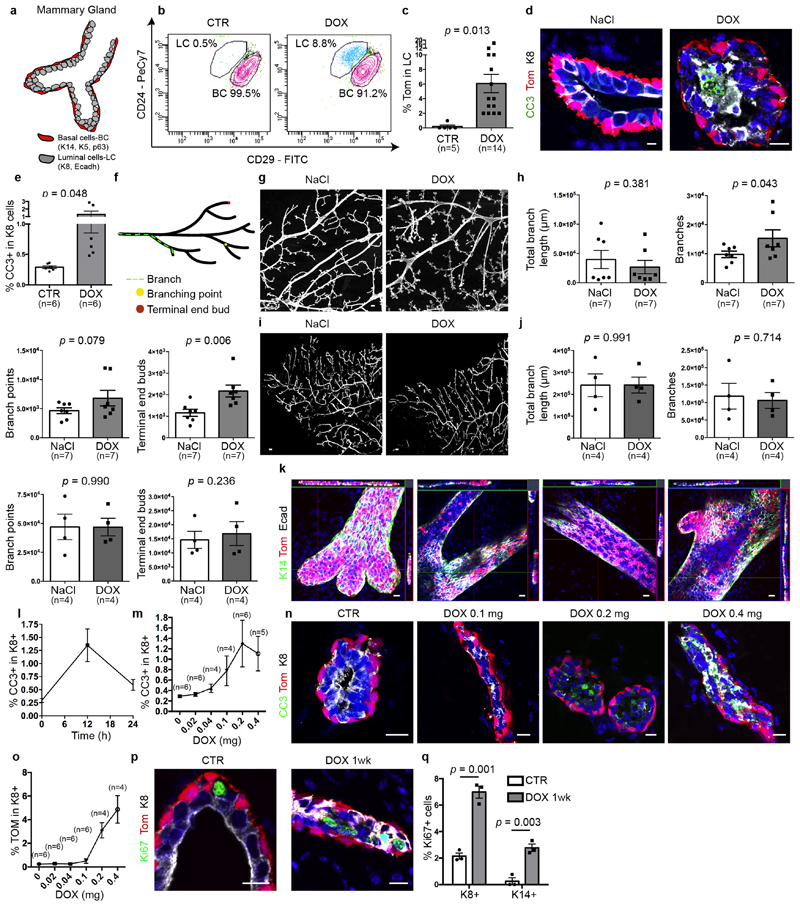
Extended Data Fig. 2. DOX administration to K5CreER/tdTomato/K8rtTA/TetO-DTA mice promotes LC death, MG remodelling and proliferation.
a, Scheme summarizing the histology of the MG and its different lineages. b, c, FACS plot of CD29/CD24 expression in Lin−tdTomato+ epithelial cells (b) and quantification of tdTomato+ LC (c) in CTR mice and 1 week after DOX administration. The percentage of the gated population from all epithelial cells is shown. Number of mice analysed is shown in parentheses. P values are derived from unpaired two-sided t-test. d, e, Confocal imaging (d) and FACS quantification (e) of immunostaining for tdTomato, cleaved caspase 3 (CC3) and K8 in K5CreER/tdTomato/K8rtTA/TetO-DTA MG after IDI with NaCl (0.29 ± 0.02 CC3+ cells) or 0.2 mg DOX (1.3 ± 0.4 CC3+ cells) and chased for 12 h (n = 6 mice per condition). Scale bar (d), 5 μm. P values are derived from unpaired two-sided t-tests. f–j, Scheme of the different parameters measured to quantify MG remodelling (f), quantification and representation after ImageJ analysis of branch length, number of branches, branch points and terminal end buds of K5CreER/Rosa-tdTomato/K8rtTA/tet-O-DTA (g, h) or K5CreER/Rosa-tdTomato/K8rtTA contralateral MG (i, j) injected either with NaCl or DOX. Number of mice analysed is shown in parentheses. Scale bars, 100 μm. P values are derived from paired two-sided t-tests. k, Confocal imaging of immunostaining for tdTomato, E-cadherin and K14 of terminal end buds, branching points and ducts where LC replacement is occurring in a patchy and focal manner throughout the gland (n = 3 mice). Scale bars, 20 μm. l, m, Graphs showing the percentage of K8+ CC3+ cells at 0 h, 12 h and 24 h (n = 3 mice per condition) after DOX injection (l) and FACS quantification of K8+ CC3+ cells 12 h after different DOX doses (m). Number of mice analysed is shown in parentheses. n, o, Confocal imaging of immunostaining for tdTomato, K8 and CC3 (n) and FACS quantification of K8+tdTomato+ cells (o) in mice after intraductal injection with NaCl or DOX at different doses after 12 h. Number of mice analysed is shown in parentheses. p, q, Confocal imaging (p) and quantification (q) of immunostaining for tdTomato, Ki67 and K8 in K5CreER/tdTomato/K8rtTA/TetO-DTA MG after IDI with NaCl or 0.2 mg DOX and chased for 1 week. Scale bars, 5 μm. n = 3 mice per condition. P values are derived from unpaired two-sided t-tests. Data are mean ± s.e.m. For the immunofluorescence data, Hoechst nuclear staining is shown in blue.

