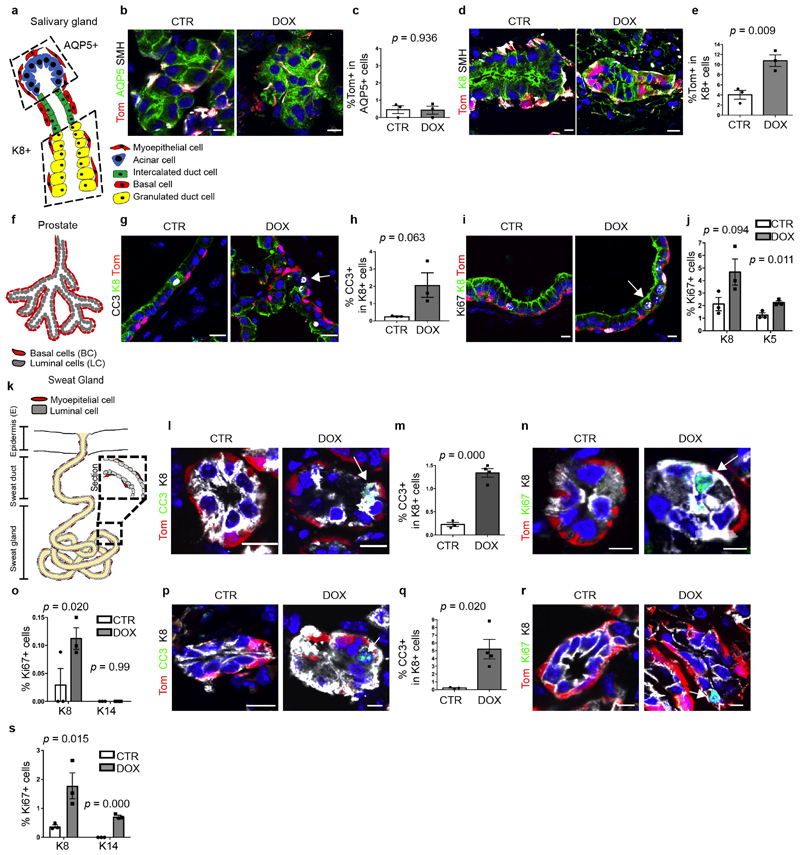
Extended Data Fig. 4. DOX administration in adult K5CreER/tdTomato/K8rtTA/TetO-DTA mice promotes LC death and proliferation in the prostate, salivary gland and sweat gland.
a, Schematic representation of the histology of the salivary gland and its lineages. b, c, Confocal imaging (b) and quantification (c) of immunostaining for tdTomato, AQP5 and smooth muscle heavy chain myosin (SMH) of salivary gland acinar cells. n = 3 mice per condition. P values are derived from unpaired two-sided t-tests. d, e, Confocal imaging (d) and quantification (e) of immunostaining for tdTomato, K8 and SMH in the granulated duct showing the contribution of BCs to replenishing granulated ductal cells during homeostasis. n = 3 mice per condition. P values are derived from unpaired two-sided t-tests. f, Schematic representation of the histology of prostate and its lineages. g–j, Confocal imaging (g) and quantification (h) of prostate immunostaining for tdTomato, K8 and CC3 or Ki67 in CTR or K5CreER/tdTomato/K8rtTA/TetO-DTA mice treated with DOX for 5 days and chased for 1 day. P values are derived from unpaired two-sided t-tests. n = 3 mice per condition. k, Schematic representation of the histology of the sweat gland and its different lineages. l–o, Confocal imaging (l, n) and quantification (m, o) of sweat gland immunostaining for tdTomato, K8 and CC3 (l, m) or tdTomato, K8 and Ki67 (n, o) in CTR or K5CreER/tdTomato/K8rtTA/TetO-DTA mice treated with DOX for 5 days and chased for 1 day. P values are derived from unpaired two-sided t-tests. n = 3 mice per condition. p–s, Confocal imaging (p, r) and quantification (q, s) of the intercalated duct of salivary gland immunostaining for tdTomato, K8 and CC3 (p, q) or tdTomato, K8 and Ki67 (r, s) in CTR or K5CreER/tdTomato/K8rtTA/TetO-DTA mice treated with DOX for 5 days and chased for 1 day. n = 4 for CC3 and n = 3 for Ki67 mice per condition. P values are derived from unpaired two-sided t-tests. Data are mean ± s.e.m. For the immunofluorescence data, Hoechst nuclear staining is shown in blue. Scale bars, 5 μm.

