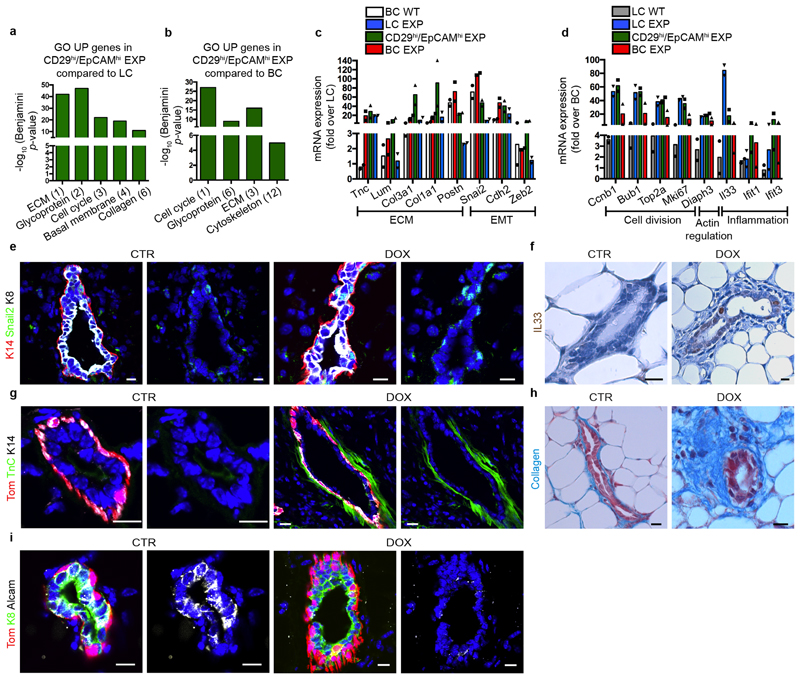
Extended Data Fig. 5. Transcriptional profiling associated with BC multipotency induced by LC ablation.
a, b, Gene ontology (GO) analysis of genes upregulated more than 2.5-fold in CD29high EpCAMhigh cells compared to LCs (a) or BCs (b). Histograms represent –log10 of the Benjamini P value. n = 2 independent experiments. c, d, Graphs representing mRNA expression measured by bulk population RNA sequencing of basal (c) and luminal (d) upregulated genes in FACS-isolated wild-type BCs, LC EXP, BC EXP, CD29high EpCAMhigh EXP. Fold change over wild-type LCs (c) or over wild-type BCs (d) of genes involved in different biological processes. n = 2 independent experiments. e, Confocal images of MGs from CTR mice or mice with IDI DOX.Immunostaining for K14, Snail2 and K8. f, Immunohistochemistry of Il33 in CTR MGs or MG after DOX IDI. g, Immunostaining for tdTomato, TnC and K14. h, Masson’s trichrome staining for collagen in CTR MGs or MG after DOX IDI. i, Immunostaining for tdTomato, Alcam and K14. n = 3 mice per condition. Hoechst nuclear staining in blue. Scale bars, 5 μm.

