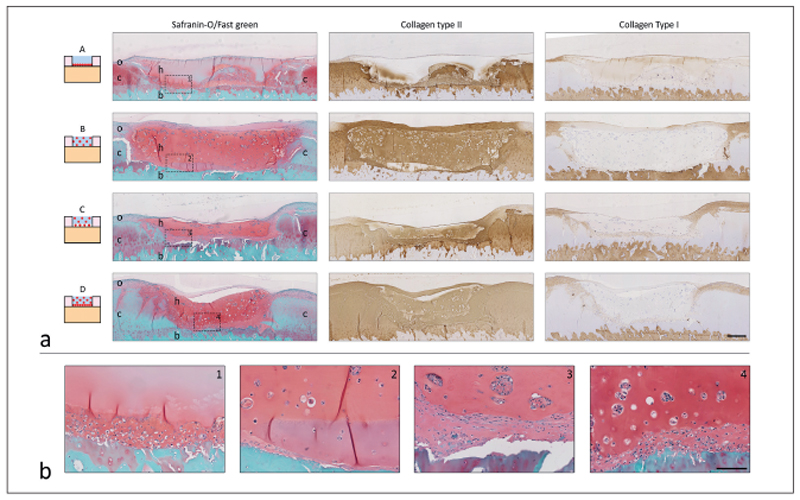
Fig. 4. Histological analysis of cartilage defects filled with conditions A-D at day 57.
a) Cross-sectional overview of each condition (# plugs = 4). Scale bar represents 400 μm and is the same for all histological images. In the safranin-O images, c, native cartilage; b, bone; h, hydrogel; o, tissue outgrowth. b) Magnification of the area indicated with the dotted square and number in the safranin-O pictures of the cross-sectional overview (a). From left to right conditions A-D. Scale bar represents 100 μm and is the same for all enlarged images.

