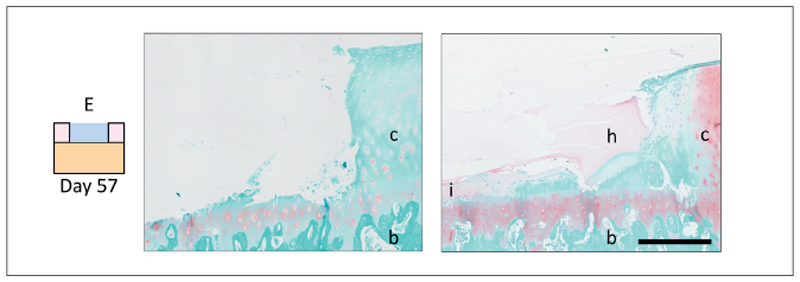
Fig. 5. Cross-sectional overview of the side of the defect area of plugs filled with condition E.
No signs of tissue remodeling or repair were visible in most of the three samples (left, hydrogel absent) while in one sample, cells were visible at the bottom of the defect after 57 days of culture (right). Scale bar represents 400 μm; c, native cartilage; b, bone; I, cell infiltration; h, hydrogel.

