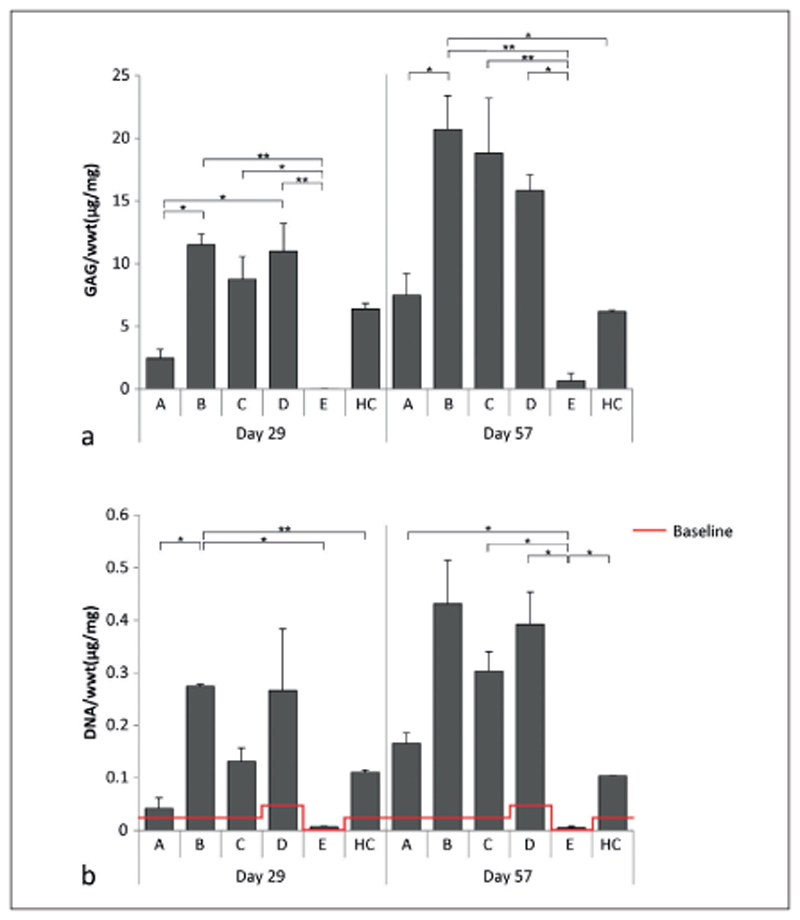
Fig. 7. Quantitative measurements of the different defect fillings.
a) GAG normalized to wwt. No GAGs were detected in the defect filling at day 1. b) DNA normalized to the wwt. At day 1 (baseline, red), 0.023 ±0.0014 μg/mg DNA/wwt was detected for defects filled with conditions A, B, C, and HC, while 0.047 ±0.0029 μg/mg DNA/wwt was detected in plugs filled with condition D, and no DNA was detected for plugs filled with condition E. For condition A-D, 3 and 4 plugs were measured at days 29 and 57, respectively, while 2 and 3 plugs were measured respectively for condition E. *, p < 0.05; **, p < 0.01 between the connected conditions.

