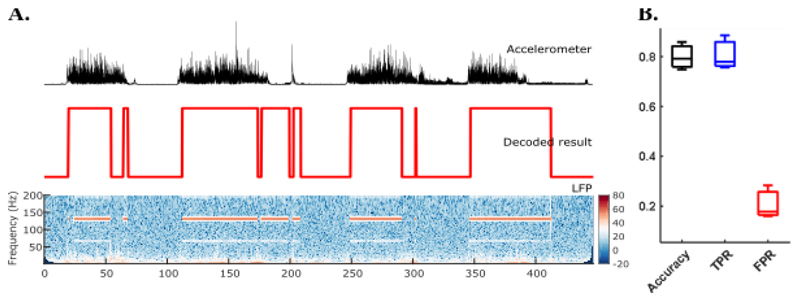
Figure 5.
Online results of voluntary movement decoding and DBS control. (A) An example of voluntary movement decoding results in ET2. The upper plot shows the acceleration signal with increased value indicating voluntary movements. The middle plot shows online decoding results with 1 and 0 for with and without movement, respectively. The bottom plot shows the power spectra of one bipolar VIM-ZI thalamic LFP signal. The red areas on the figure indicate stimulation artefacts at 130 Hz and sub-harmonics when stimulation was switched on. (B) Averaged accuracy, true positive rate (TPR), and false positive rate (FPR) of voluntary movement decoding across three patients

