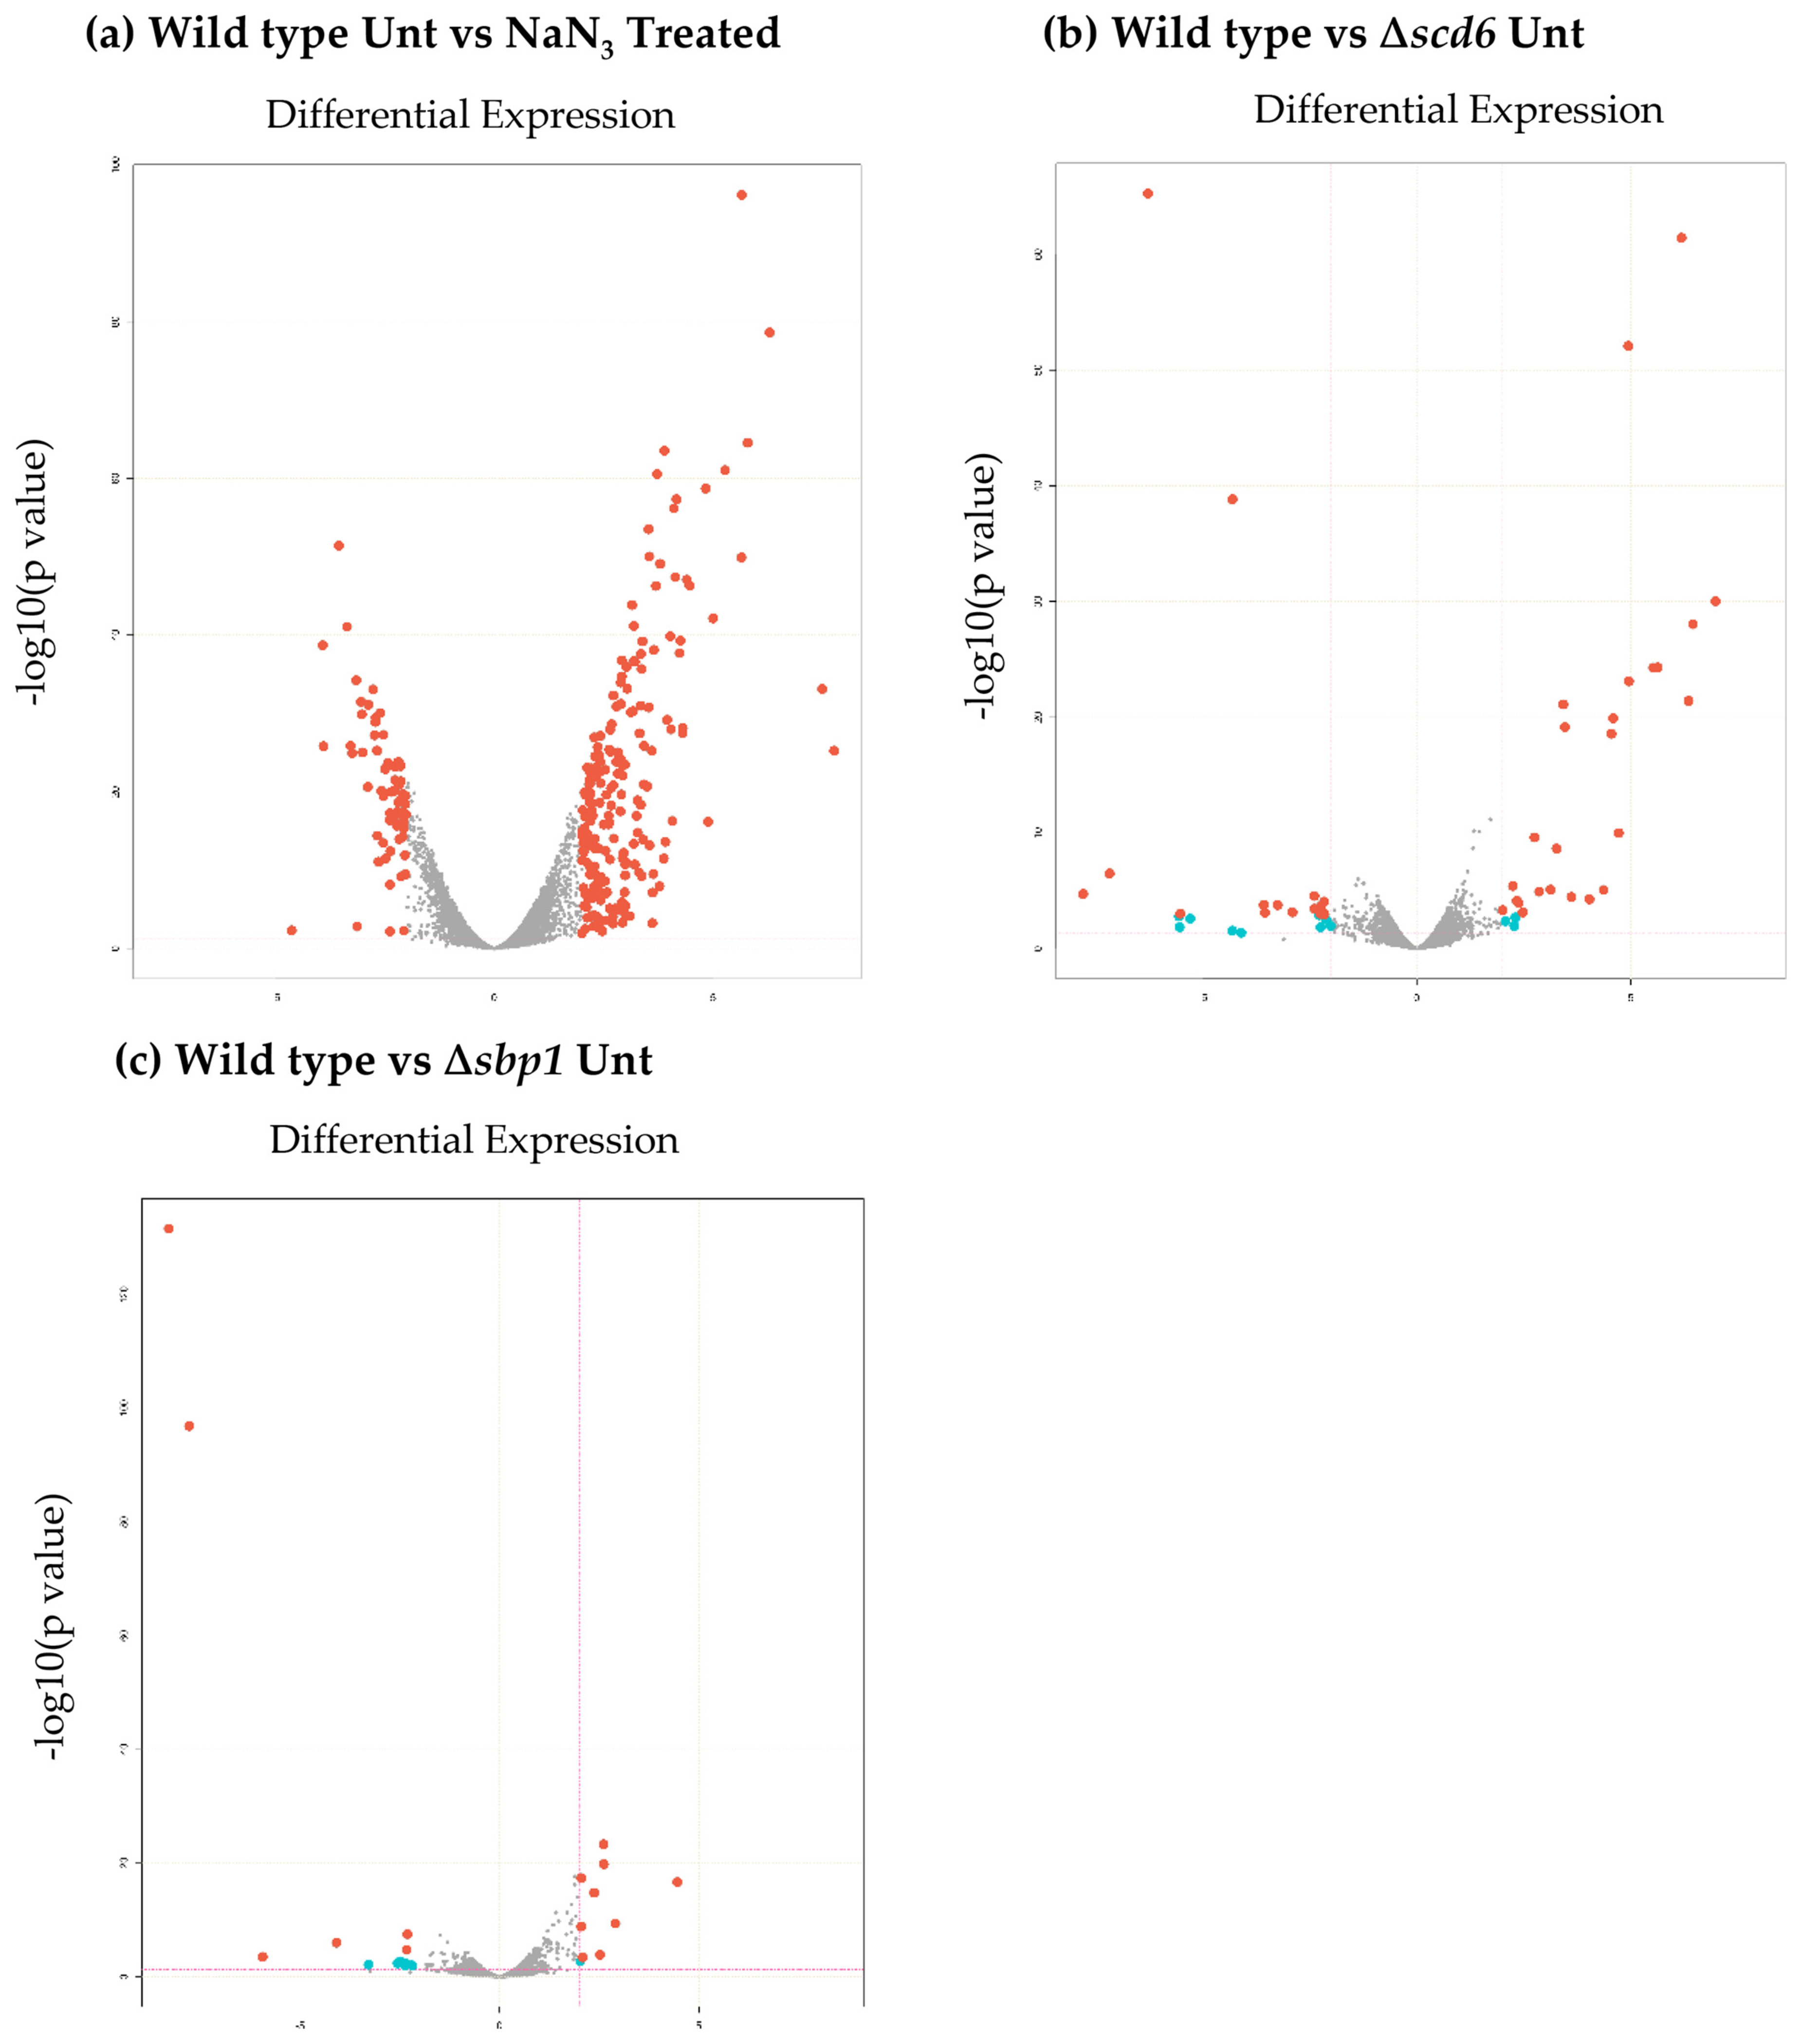
Fig. 3.

Volcano plot showing changes in transcript levels in: (a) wild type cells upon sodium azide treatment, (b) wild type cells upon deletion of Scd6 and, (c) wild type cells upon deletion of Sbp1. Red dots indicate absolute log2fold change≥2 and FDR/adjusted p-value≤.05. Blue dots indicate log2fold change≥2 and pvalue≤.05. (For interpretation of the references to colour in this figure legend, the reader is referred to the web version of this article.)
