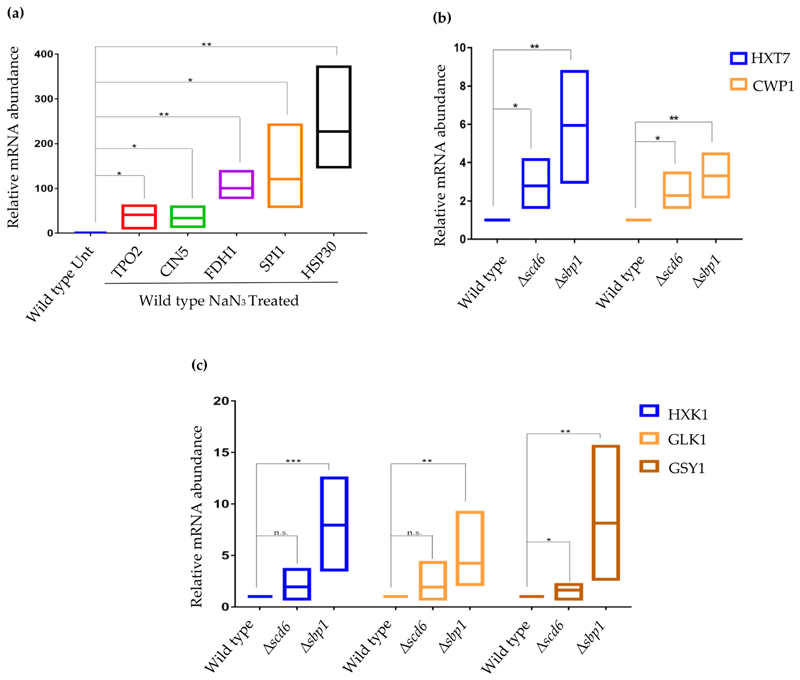
Fig. 5.
Validation of differentially expressed genes by qRT-PCR analysis in (a) wild type untreated vs NaN3 treated cells and (b) wild type vs Δscd6/Δsbp1 cells and (c) wild type vs Δscd6/Δsbp1 cells. Internal control for (a) and (b and c) are PGK1 and SCR1, respectively (n > 3; *, ** and *** denotes p-value > .05, p-value > .01 and p-value > .001 respectively).

