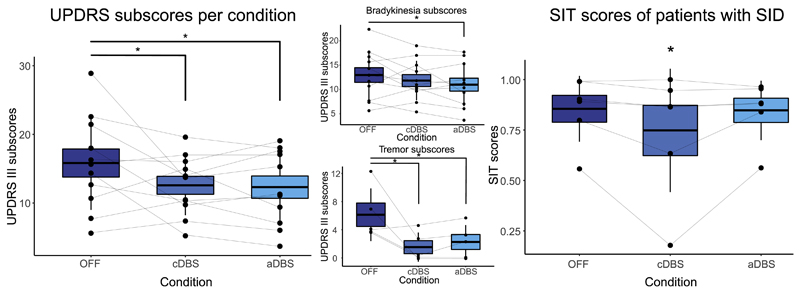
Fig. 3. Scatter plots of the subUPDRS (means of the scores from the three independent raters per condition per patient) and SIT scores. Boxplot indicates the standard error of the mean, and upper and lower lines the standard deviation. Lines connect data from the same patient.
Left: total subUPDRS scores.
Upper center: subscores of bradykinesia items of the UPDRS III.
Lower center: subscores of tremor items of the UPDRS III.
Right: SIT scores of patients with SID.

