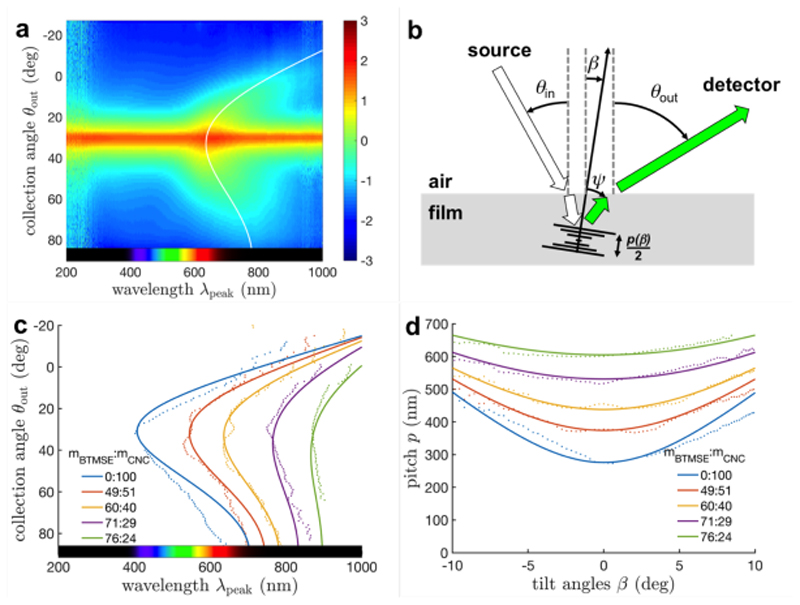
Figure 2.
a) Angular-resolved optical spectroscopy of an OS/CNC composite film (m BTMSE: m CNC = 60:40) reporting the light intensity as a heatmap vs collection angles θ out and wavelengths λ and a fit (solid line, using Equations 1-5 and θ in = 30°). b) Schematic of the goniometer set-up and the angle definition. c) Peak wavelength λ peak reflected at different θ out (data in dots, fits in solid lines) and d) the corresponding pitches.

