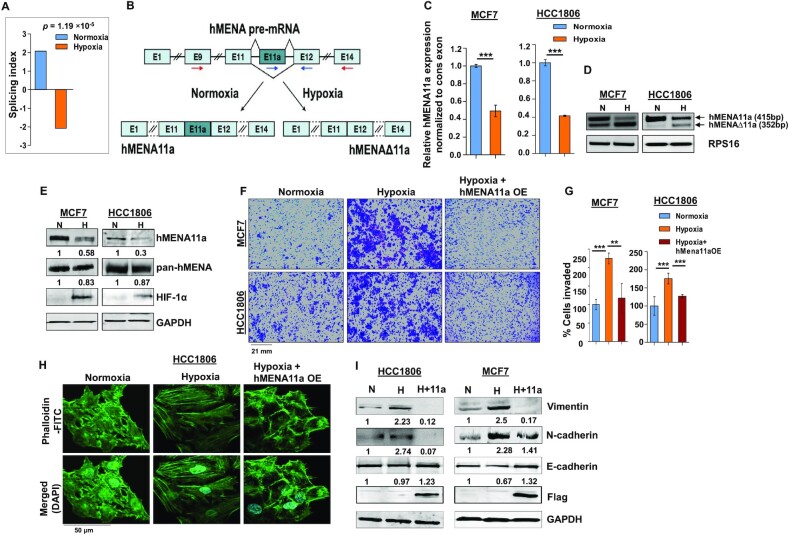
Figure 1.
hMENA11a isoform is downregulated under hypoxia, augmenting actin polymerization and invasive properties of breast cancer cells. (A) Triple-negative breast cancer samples (n = 165) from the microarray dataset GSE76250 were stratified into normoxic and hypoxic, followed by AS analysis to check the levels of inclusion of exon 11a of hMENA gene. The reversal of the inclusion of exon 11a in hypoxic samples as compared to normoxic samples is represented by the SI values. (B) Schematic of hMENA splicing demonstrating the exclusion and inclusion of exon 11a in hypoxia and normoxia, respectively. Red arrows indicate position of primers used for semi-quantitative PCR and blue arrows indicate positions of qRT-PCR primers. (C) Real-time PCR for hMENA 11a isoform (Ct values normalized to RPS16) and (D) semi-quantitative PCR of hMENA (using exon9 forward and exon15 reverse primers) showing upper (exon 11a included) and lower (exon 11a excluded) bands (RPS16 used as a control), 24 h after hypoxic treatment in MCF7 and HCC1806. (E) Immunoblotting of hMENA11a, pan-hMENA and HIF-1α under normoxia (N) and hypoxia (H) in MCF7 and HCC1806 (GAPDH as a control). (F) Invasion assay and (G) its quantification (as % cells invaded), in MCF7 and HCC1806, and (H) phalloidin staining, in HCC1806, after 48 h under normoxia, hypoxia and hMENA11a overexpression (OE) under hypoxic conditions. (I) Immunoblotting of vimentin, N-cadherin, E-cadherin and Flag under normoxia, hypoxia and hMENA11a overexpression in HCC1806 and MCF7 (GAPDH as a control). Error bars show mean values ± SD (n = 3 unless otherwise specified). As calculated using two-tailed Student’s t-test, **P < 0.01 and ***P < 0.001.

