
Figure 4.
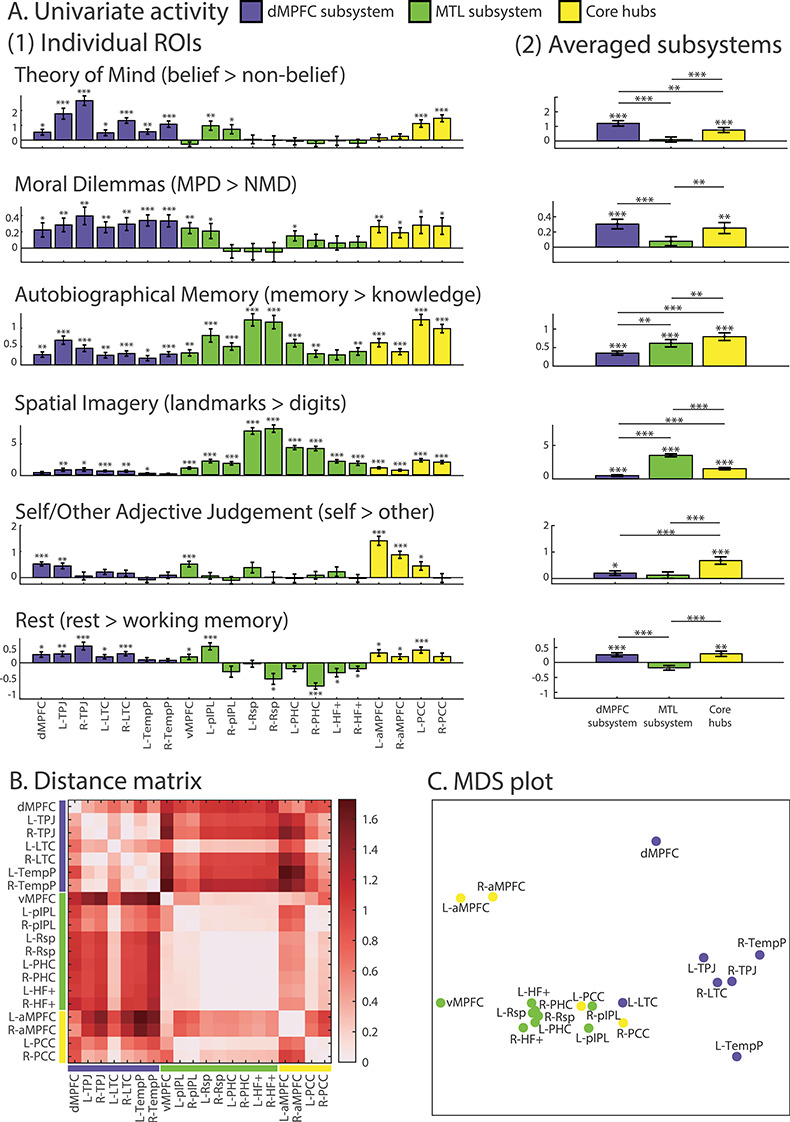
(A) Activity (difference in beta) for each task contrast, for individual ROIs (1) and averaged over ROIs in each subsystem (2). Error bars represent standard error. t-tests against zero were conducted for each contrast. *** indicates P < 0.001, ** indicates P < 0.01, and * indicates P < 0.05 (all tests were corrected for multiple comparisons using FDR). Note that scales differ for different contrasts. (B) Dissimilarity matrix calculated using 1 − Pearson’s r between ROIs based on their activity profile across the six tasks. (C) MDS to visualize the dissimilarity between regions. L- and R- indicate left and right.