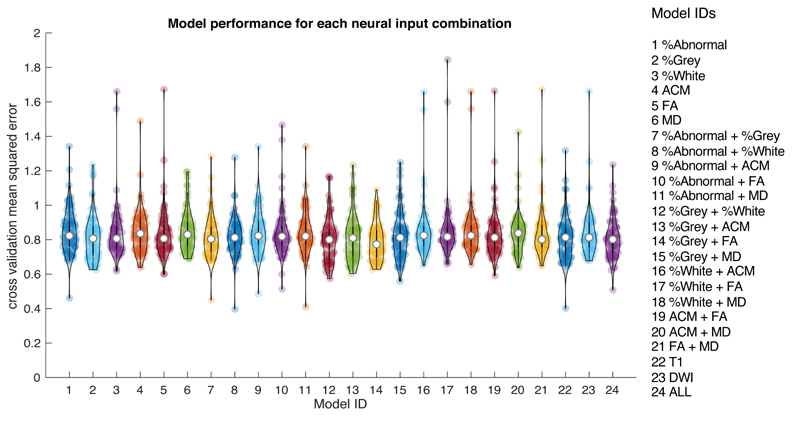
Figure 4.
Violin plots showing model performance (mean squared error between observed and predicted) for each neural input feature set used in this study (see Model IDs on the right for information) Each coloured dot represents the result of one model configuration and the white central dot represents the median.

