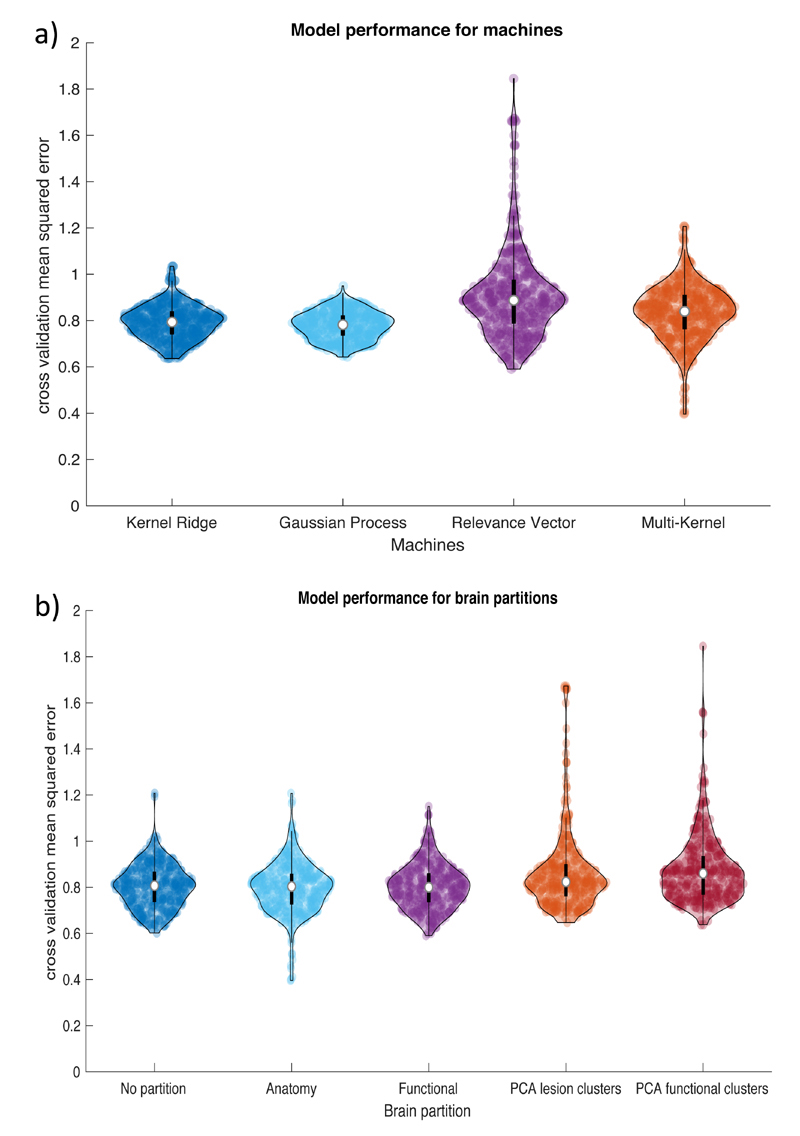
Figure 5.
Violin plots showing model performance (mean squared error between observed and predicted) for: A) four machine learning regression algorithms and B) five brain partitions. Each dot represents the result for one model configuration and the white circle represents the median. Abbreviations: principal component analysis (PCA).

