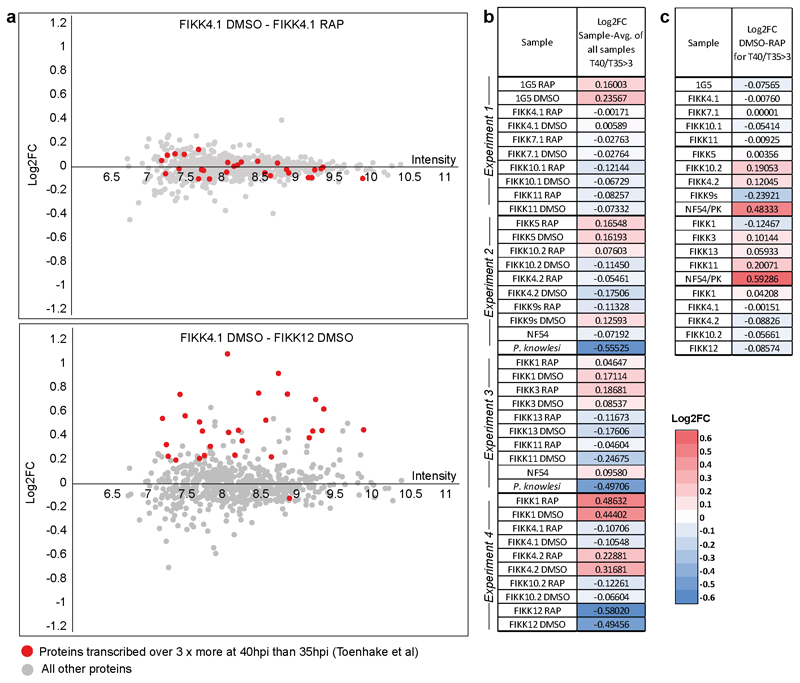
Extended Data Fig. 6. Unenriched proteome analysis of FIKK KO lines shows no difference in growth upon RAP-Treatment.
(a) Plots showing the Log2 Fold change in protein intensity (y axis) between FIKK4.1 DMSO and FIKK4.1 Rap (Upper panel) and between FIKK4.1 DMSO and FIKK12 DMSO (lower panel), against the total intensity for all samples. Protein intensity was calculated from the average reporter intensity of all peptides on a protein, and only proteins for which more than 1 peptide was detected were included. In red are all proteins transcribed 3x more at 40 hpi than at 35hpi, according to RNA seq data 1. Between DMSO and RAP-treated lines the intensity of these proteins do not change substantially, while there is a clear increase in the FIKK4.1 DMSO line relative to FIKK12 DMSO, while all other proteins remain the same indicating a likely difference in growth. (b and c) To establish differences in growth between the lines, the log2 fold change in the intensity of the late-stage proteins between each line and the average of all lines within the experiment were calculated (b), or between RAP and DMSO-treated FIKK cKO lines (c). The log2 fold change for all other proteins was then subtracted from this to control for differences in protein abundance between samples.

