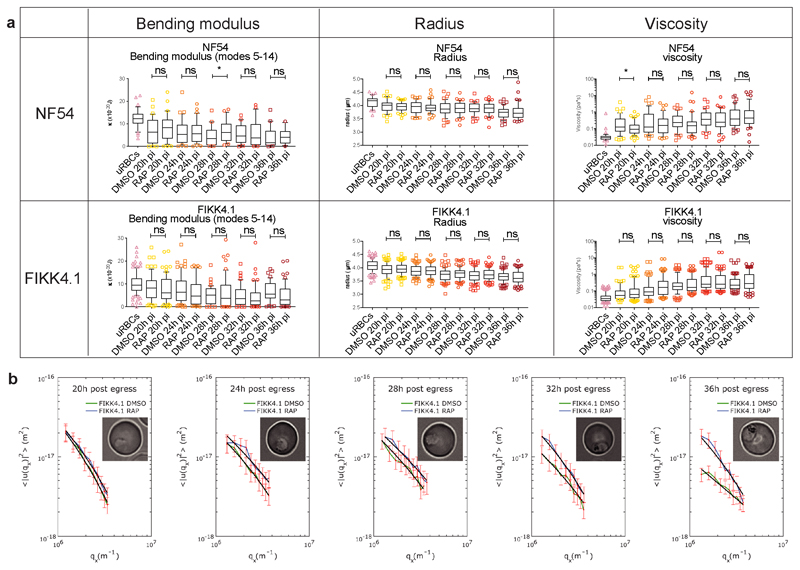
Extended Data Fig. 8. Flickering analysis of FIKK4.1 knockout.
(a) Time-course flicker spectroscopy comparing the membrane bending modulus, the radius and the viscosity of uRBCs and RBCs infected with NF54::DiCre and FIKK4.1::DiCre DMSO- or RAP- treated parasites. Horizontal line within the box represents the median and whisker boundaries represent the 10th and 90th percentile. Points represent outliers. Statistical significance was determined by a two-tailed t-test. Precise p-values are included in supplementary information table 3. n = 2 biologically independent samples, the number of cells counted for each condition are summarised in supplementary information table 1. * p<0.05; NS, not significant. (b) Representative flickering spectra of DMSO- (in green) or RAP-treated (in blue) FIKK4.1::DiCre parasites at increasing time post-invasion. Mean square amplitude of fluctuations remains similar for DMSO-treated FIKK4.1::DiCre parasites throughout parasite development, while fluctuations in FIKK4.1 knockout parasites decrease significantly at 32 and 36 hours post-invasion. Fitted modes 5-14. The error bars are calculated as where SD is the standard deviation, n total number of frames (10000 frames per cell), dt time gap between each frame, and τqx the relaxation time for each mode. N = two biologically independent experiments.

