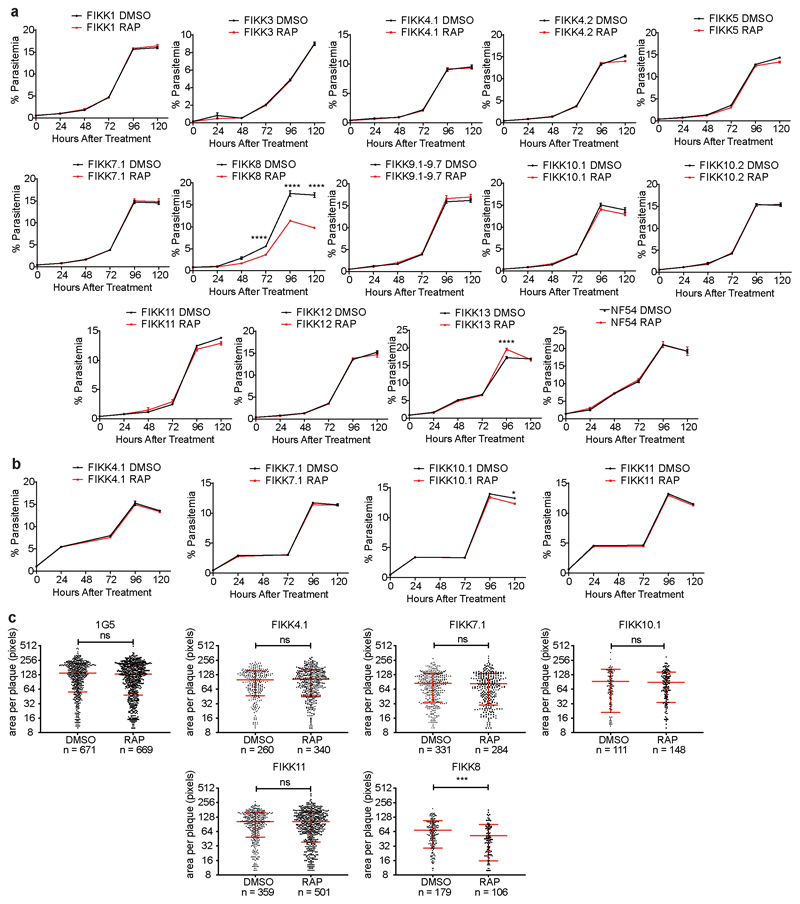
Extended Data Fig. 4. Exported FIKK kinases do not play a role in parasite growth under standard culture conditions.
(a and b) Parasite growth curves for Plasmodium falciparum NF54 (a) and 1G5 (b) FIKK conditional knockout lines. Starting parasitemia was adjusted to 0.5% and samples were fixed every 24 hours for 120 hours (excluding at 48 h for the 1G5 lines). Parasitemia was measured by flow cytometry on 3 biological replicates for all FIKKs, and the mean and SEM are shown. Statistical analysis by two way ANOVA with Tukey correction for multiple comparisons. (**** p≤0.0001, * p ≤ 0.05, NS, not significant). Precise P values are shown in supplementary information table 2. (c) Scatter plots showing the area of plaques obtained by plaque assay for 1G5 FIKK conditional knockout lines, DMSO- (left) or RAP-treated (right). Horizontal bars indicate mean plaque area ± SD. Statistical significance was determined by a two-tailed t-test with no adjustment for multiple comparisons: 1G5 DMSO vs RAP (p=0.1626); FIKK4.1 DMSO vs RAP (p=0.4306); FIKK7.1 DMSO vs RAP (p=0.7201); FIKK10.1 DMSO vs RAP (p=0.5686); FIKK11 DMSO vs RAP (p=0.7912); FIKK8 DMSO vs RAP (p=0.0008) n = number of plaques, *** p<0.001, NS, not significant.

