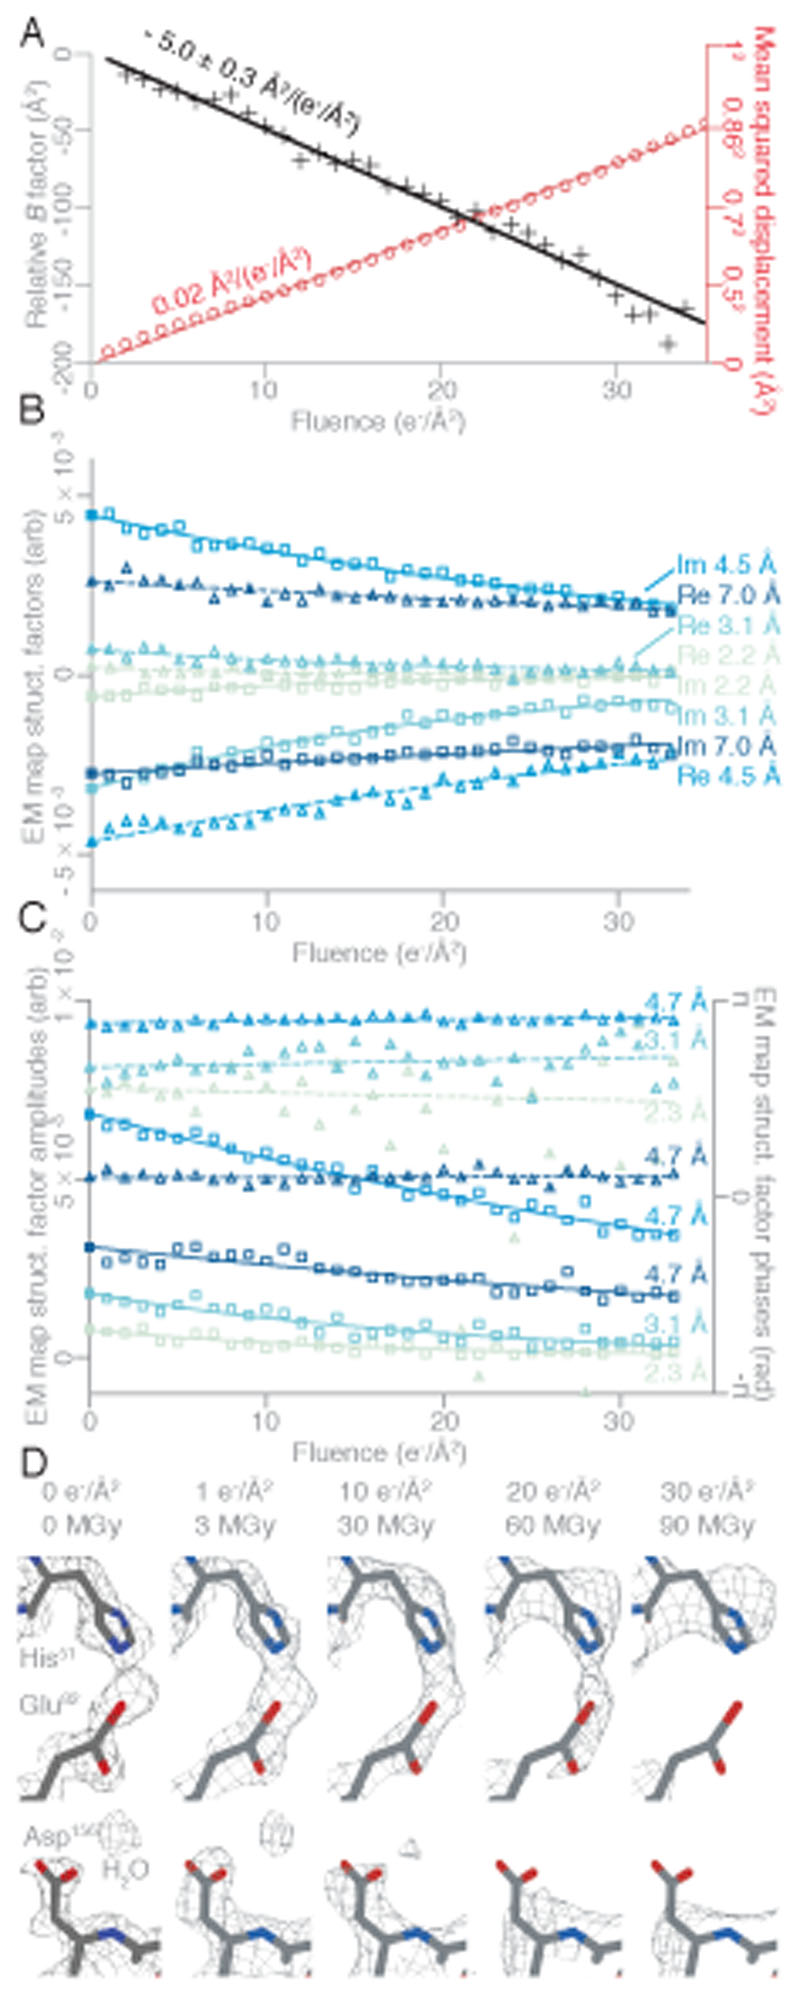
Fig. 4. Structure of DPS determined at ˂2 Å resolution by extrapolation to zero dose with the use of a 260 nm hole support.
(A) Plot of the mean squared displacement during irradiation (red) for all DPS particles used in the reconstruction, and the relative B-factor for each frame with respect to the first (black) with linear fits to both. The displacement of the particles corresponds to diffusion with a constant of 0.02 Å2/(e−/ Å2) (red line). The B-factor decay which agrees with the expected slope from radiation damage alone (32). (B) The real (triangles) and imaginary (squares) parts of selected Fourier pixels are plotted as a function of fluence. (C) The phases (triangles) and amplitudes (squares) of selected Fourier pixels (at 2.3 Å, 3.1 Å, and two different pixels at 4.7 Å resolution) are plotted as a function of fluence. The real and imaginary parts (B), or phases and amplitudes (C) are extrapolated to their values before the onset of irradiation, corresponding to the undamaged structure (solid symbols at 0 fluence). The lines in (B) and (C) are exponential fits (to the real parts, imaginary parts, and amplitudes), or linear fits (to the phases). (D) Selected side chains and a water molecule from zero-dose extrapolated and per-frame DPS reconstructions show the progression of radiation damage. The residues from the refined model are colored by atom (C - gray, N - blue, O - red), and the contoured density map is shown as a mesh

