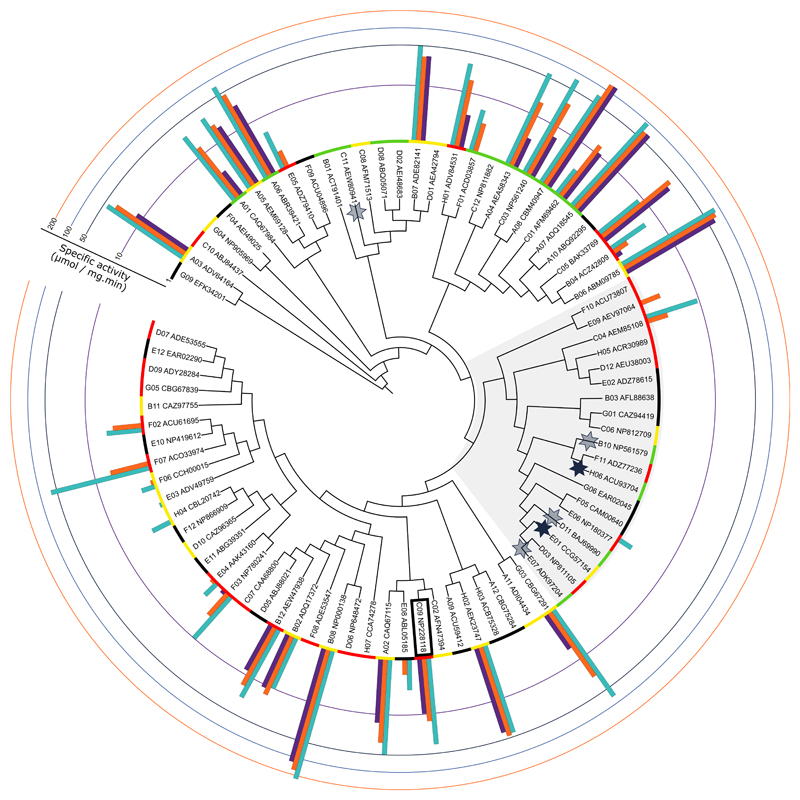
Figure IV. Annotation of the expression yields and specific 4-NPF hydrolysis activity onto the GH29 subset guide tree.
The expression yields are categorized with color codes where green = above 50 mg/L; yellow = between 1 and 50 mg/L; red = below 1 mg/L; and black = below 150 μg/ml. Specific activities at three pH conditions are shown in a log scale where light blue bars represent pH 5.5; orange bars pH 6.5; and purple bars pH 7.5. Proteins with activity towards branch α1-3 fucoses on N-glycans from the human α1-acid glycoprotein are shown with a star, where shaded stars represent activity only on glycans that were isolated from AGP and full stars activity also on the intact glycoprotein. The T. maritima fucosidase is boxed, and the shaded area corresponds to the GH29-B subfamily.

