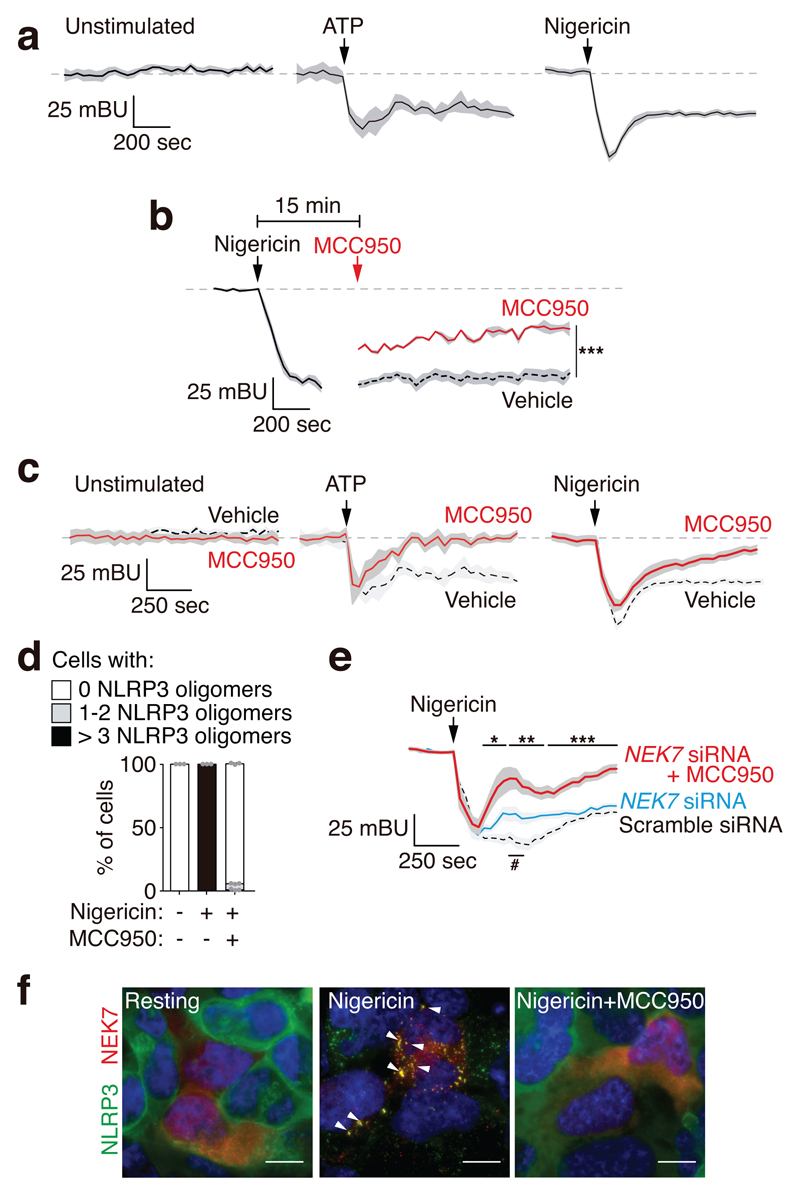
Figure 3. MCC950 affects NLRP3 conformation upon activation.
a-c, BRET signal for YFP-NLRP3-Luc in HEK293T cells treated or not with nigericin (10 μM) or in HEK293T cells stable expressing P2X7 receptor treated with ATP (3 mM) (a), in the presence or absence of MCC950 (10 μM) incubated 35 min before nigericin or ATP stimulation (red trace in c). In b 15 min after nigericin stimulation, cells were washed, then MCC950 (10 μM) or vehicle was added and BRET was recorded (a representative trace for the initial response to nigericin is included to compare). Mean (black or red line) ±SEM (grey shadow) are shown; for exact n number see Methods, section Statistics and Reproducibility; Mann-Whitney test, two-tailed for each time comparing vehicle with MCC950, ***p<0.0008 (for each time point, exact p and U value are annotated in supplementary datasheet for figure 3). d, Quantification of the number of wild type NLRP3-YFP oligomers per HEK293T cells incubated or not for 30 min with MCC950 (10 μM) and then stimulated or not for 30 min with nigericin (10 μM). Data are representative of n=3 independent experiments and centre values represent mean and error bars the SEM from 1000-1500 cells. e, HEK293T cells transfected with scramble or NEK7 siRNA and then YFP-NLRP3-Luc BRET kinetic was measured before and after nigericin (10 μM) treatment in the absence (blue and dashed trace) or presence of MCC950 (10 μM, red trace). n=11 independent experiments, and mean (blue, red or dashed trace) ±SEM (grey shadow) are shown. Mann-Whitney test, two-tailed for each time comparing vehicle vs MCC950 (*p<0.05; **p≤0.005; ***p≤0.0002) or comparing scramble vs NEK7 siRNA (#p<0.05); for each time point, exact p and U value are annotated in supplementary datasheet for figure 3. f, Representative maximum intensity fluorescence images of HEK293T cells expressing NLRP3-YFP and NEK7 incubated or not for 30 min with MCC950 (10 μM) and then stimulated for another 30 min with nigericin (10 μM). NLRP3, green; NEK7, red; nuclei, blue DAPI; bar 10 μm; arrowheads denote NLRP3 and NEK7 co-localization. Images are representative of n=3 independent experiments with similar result.

