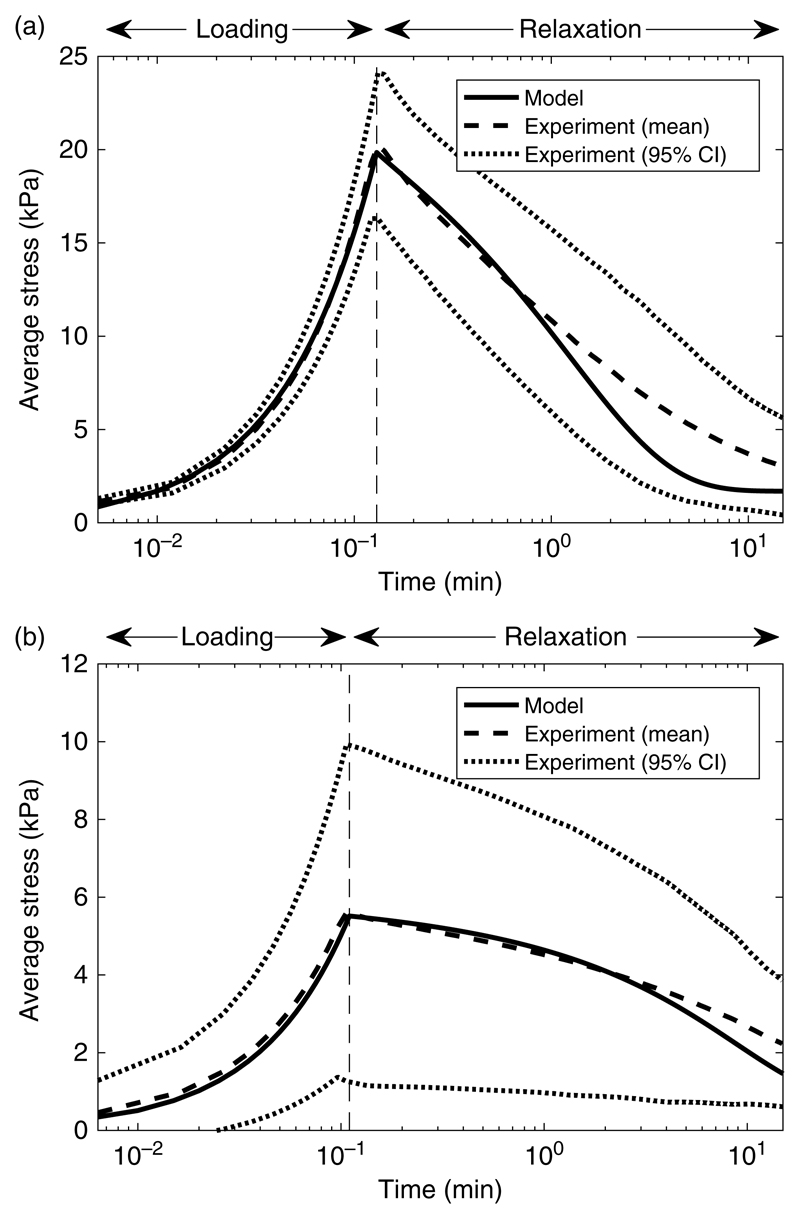
Figure 4.
Numerical simulations of the relaxation text compared with the experimental data. (a) 300 μm fibre spacing with adjusted modelling parameters of ξ = 0.45%, E f = 90.8 MPa and ν f = 0.49 (solid line). (b) 800 μm fibre spacing with adjusted modelling parameters of ξ = 0.525%, E f = 45.4 MPa and ν f = 0.49 (solid line). Both (a) and (b) show the mean time-dependent stress from three replications of the experimental relaxation test (dashed line) and a 95% confidence interval on these data (dotted lines). Note that 300 μm fibre spacing data is the same as that shown in Figure 2 with a log scale on the vertical axis.

