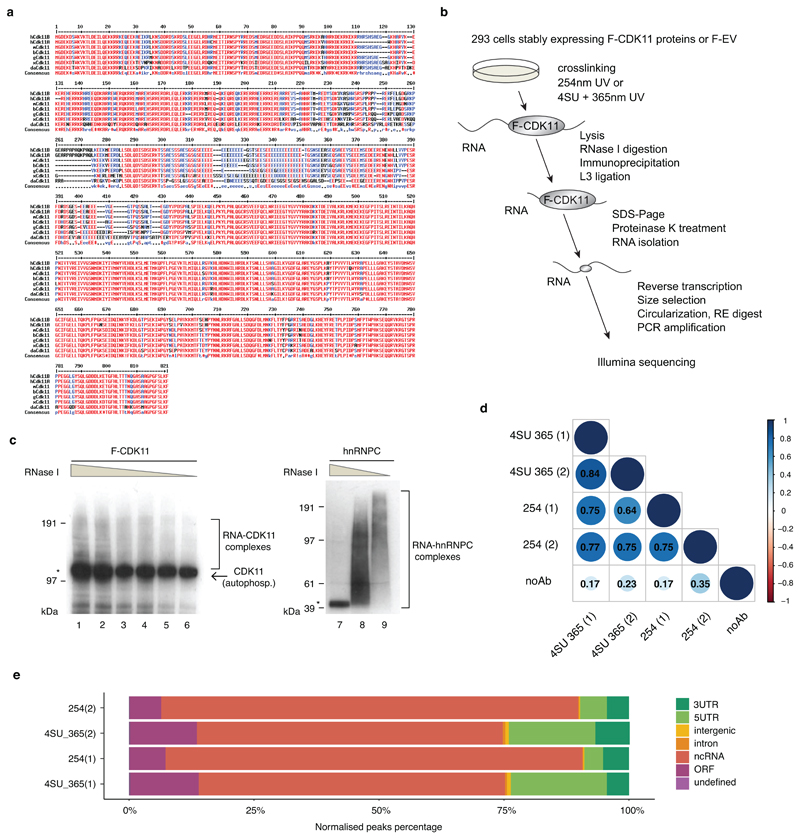
Extended Data Fig. 4. CDK11 is an evolutionary conserved RNA-binding protein.
a, Alignment of CDK11 protein sequences from different species by the MultAlin program. CDK11 protein sequences from human (Homo-hCDK11B (NP_001778.2) and hCDK11A (NP_001300825.1)), mouse (Mus-mCDK11 (NP_031687.2)), cow (Bos-bCDK11 (NP_001007812.2)), chicken (Gallus-gCDK11 (NP_001026042.2)), frog (Xenopus-xCDK11(NP_001086696.1), and zebra fish (Danio-dCDK11 (NP_001008646.1)) were obtained from the NCBI database. Numbers above the alignment indicate amino acid numbering. Red, blue and black colored letters indicate amino acid consensus, similarity, and difference, respectively.
b, Schema of iCLIP workflow. Big and small grey ovals correspond to a full length F-CDK11 protein and a CDK11 peptide, respectively crosslinked to RNA (black line). RE=restriction enzyme.
c, 293 cell lines stably expressing flag-tag CDK11 (F-CDK11) or endogenous hnRNPC (used as iCLIP procedure positive control with the canonical RNA-binding protein) were treated with 4SU for 6 hr and irradiated with 200mJ/cm2 at 365nm. Lysates were either treated with decreasing concentrations of RNase I or left untreated. The RNA-protein complexes were resolved on SDS-PAGE and visualized by autoradiography. Clamps on the side of the panels and asterisk indicate RNA-protein complexes and collapsed RNA-protein band after high RNase I treatment, respectively. Band corresponding to autophosphorylated CDK11 is shown by the arrow.
d, Significant iCLIP crosslinks (FDR > 0.05) were matched with their transcripts and correlated between the indicated biological replicates of depicted F-CDK11 and no Ab iCLIP libraries. Numbers inside blue balls correspond to R2 (Pearson correlation coefficient).
e, Percentage of significant bound genomic regions (FDR > 0.05) normalized by region length. Biological replicates of F-CDK11 iCLIP libraries are labelled on the left, individual genomic regions are differentiated by a color code.

