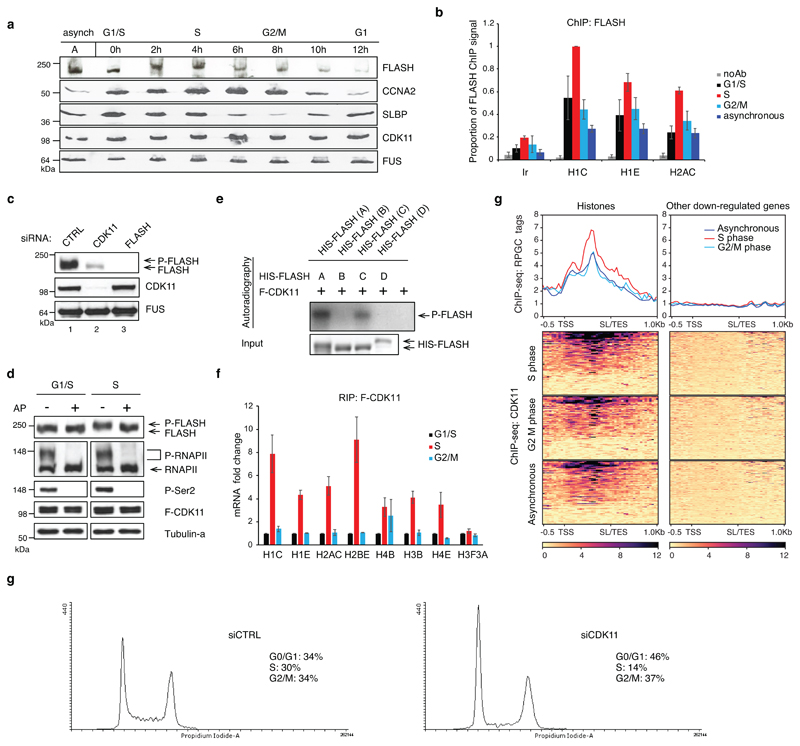
Figure 3. CDK11 is recruited to RDH genes predominantly in S-phase.
a, Western blot analyses of extracts of HCT116 cells released from double thymidine synchronization. Time points after the release and cell cycle phases are indicated. Cell cycle phase markers: CCNA2=cyclin A2, SLBP. A=asynchronous cells, 0 h=time of the release.
b, FLASH ChIP-qPCR on selected RDH genes in asynchronous and G1/S, S and G2/M synchronised HCT116 cells. FLASH ChIP-qPCR signals are normalised to the maximum signal which was set as 1. n=3 biologically independent experiments, error bars=SEM, Ir=intergenic region.
c, Western blot analyses of FLASH and phosphorylated FLASH (P-FLASH) in cell lysates of HCT116 cells treated with either control or CDK11 or FLASH siRNAs for 48 h.
d, Western blot analyses of lysates of HCT116 cells synchronized by double thymidine treatment in G1/S-phase and released 2 h into the S-phase. The lysates were treated or were not with alkaline phosphatase (AP). The phosphorylated and dephosphorylated forms of FLASH and control RNAPII and Ser2 are indicated at right by clip marks and arrows, respectively. The blots were probed with indicated antibodies. P-FLASH, P-RNAPII and F-CDK11 are phosphorylated FLASH, RNAPII and Flag-tagged CDK11, respectively.
e, IVKA visualized by autoradiography (upper panel). His-tagged deletion mutants of FLASH expressed in bacteria were incubated with purified CDK11 in the presence of [γ-32P] ATP. P-FLASH=phosphorylated FLASH. Western blotting of inputs of FLASH deletion mutants (lower panel).
f, Graph displays RNA immunoprecipitation (RIP) of histone transcripts with F-CDK11 from HCT116 cells synchronized in G1/S-, S- and G2/M-phases. Graph shows fold change of CDK11 binding to RDH mRNA normalized to MAZ mRNA binding. mRNA levels in G1/S were set as 1 for each transcript. n=3 biologically independent experiments, error bars=SEM.
g, CDK11 ChIP-seq on the RDH and 200 other down-regulated genes in either HCT116 cells asynchronous or synchronized in S- or G2/M-phases. For asynchronous and S or G2/M n=4 and 2 biologically independent experiments, respectively.
h, Histograms of cell cycle analyses of HCT116 cells transfected with control (CTRL) or CDK11 siRNA for 36 h. Percentage of cells in G0/G1-, S- and G2/M-phases are displayed.
Source data for panels b and f are available with the paper on line.

