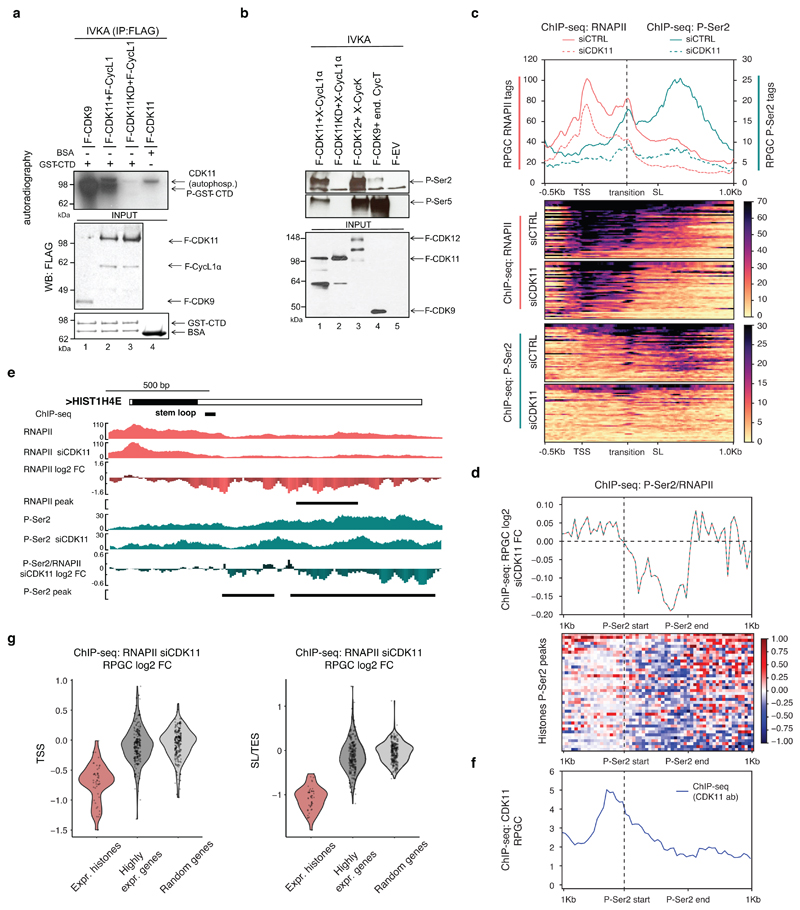
Figure 5. CDK11 promotes transcriptional elongation of RDH genes.
a, GST-CTD or BSA was incubated with the indicated cyclins/CDKs in the presence of [γ- 32P] ATP, the resulting kinase reactions (IVKA) were resolved on SDS-PAGE gel and visualized by autoradiography. Phosphorylated GST-CTD (P-GST-CTD) and autophosphorylated CDK11 is shown (upper panel). Equal input of flag-tagged cyclins/CDKs and GST-CTD to the IVKA were confirmed by western blotting with anti-flag antibody (middle panel) or by Coomassie staining (lower panel), respectively.
b, Displayed cyclins/CDKs purified from HCT116 cells were incubated with GST-CTD in IVKA. Phosphorylation was monitored by the indicated antibodies by Western blotting (upper panel). Input of equal amounts of flag-tagged CDKs into IVKA was validated by flag antibody (lower panel). F=flag tag, X=xpress tag, KD=kinase dead mutant, end=endogenous, EV=empty vector.
c, ChIP-seq analyses of RNAPII and P-Ser2 occupancies on expressed RDH genes in HCT116 cells treated with either control (CTRL) or CDK11 siRNA. Transcription elongation “transition” point is indicated by dashed line. n=3 biologically independent experiments.
d, P-Ser2/RNAPII normalized ChIP-seq log2 fold change on RDH genes after CDK11 knockdown within differential P-Ser2 MACS2 peaks (depicted as P-Ser2 start (vertical dashed line) and P-Ser2 end).
e, HIST1H4E gene tracks with raw RNAPII and P-Ser2 ChIP-seq data and RNAPII, P-Ser2 and P-Ser2/RNAPII log2 fold change after CDK11 depletion. Black line indicates differential peaks identified by MACS2 program (p<0.05).
f, CDK11 ChIP-seq occupancy is most abundant just upstream of the differential P-Ser2 MACS2 peaks in RDH genes. The start of the P-Ser2 peaks is indicated by vertical dashed line (see also Fig. 5d for metaplot and heatmap).
g, Violin-plots measure RNAPII occupancy on the TSS (top panel, flank 500 nt) and SL or TES (bottom panel, 250 nt upstream and 750 nt downstream) of expressed RDH and 200 highly expressed and randomized genes.

