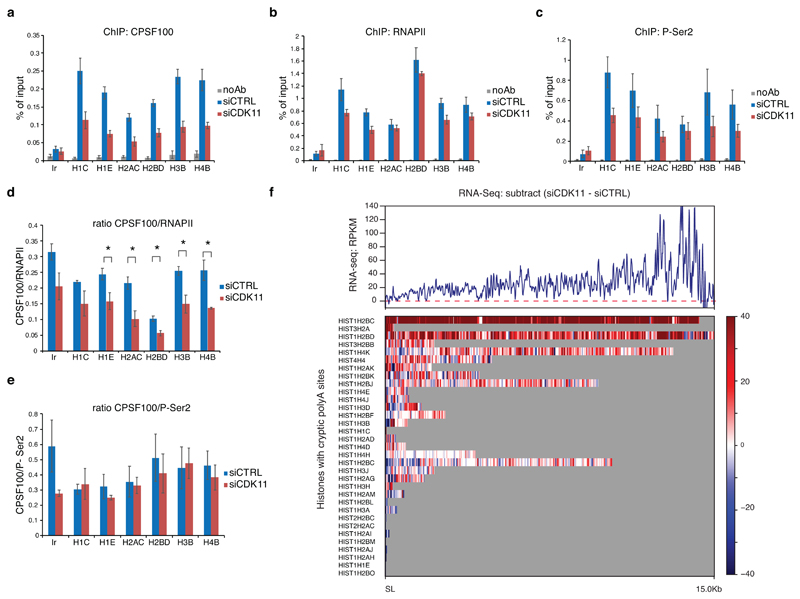
Figure 6. Recruitment of 3´ end processing factor CPSF100 to the RDH genes depends on CDK11-mediated phosphorylation of Ser2.
a, b, c, Graphs present ChIP-qPCR data for CPSF100 (a), RNAPII (b) and P-Ser2 (c) in HCT116 cells transfected with control (siCTRL) or CDK11 (siCDK11) siRNA. qPCR primers were designed in coding regions of RDH genes. n=4, n=3 and n=3 biologically independent experiments for (a), (b) and (c), respectively; error bars=SEM, Ir = intergenic region.
d, e. Graphs present ratios of CPSF100/RNAPII (d) and CPSF100/P-Ser2 (e) ChIP-qPCR signals. n=4 and 3 biologically independent experiments for (d) and (e), respectively; error bars=SEM, *P<0.05, Student´s two-sided t-test.
f, Subtracted RNA-seq (siCDK11 - siCTRL) RPKM normalized downstream of the SL until the next conserved polyadenylation site (33 RDH genes; distance from 27 nt to 15 kb) (upper panel). The read-through is depicted for indicated individual RDH genes carrying cryptic polyadenylation site downstream of SL (lower panel).
Source data for panels a-e are available with the paper on line.

