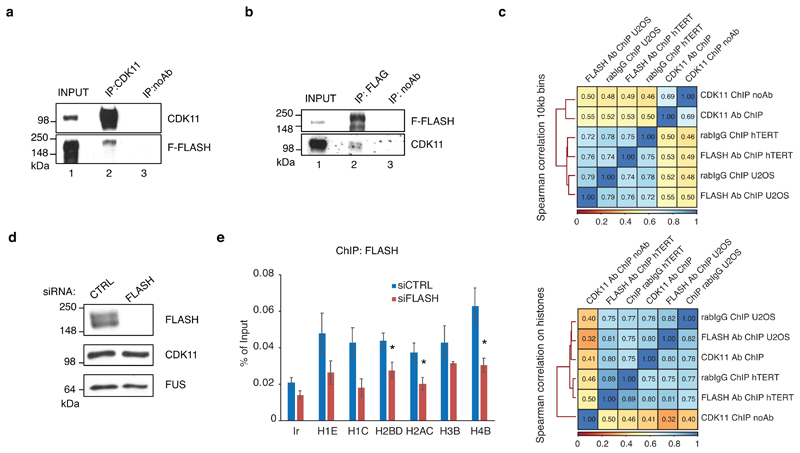
Extended Data Fig. 2. CDK11 and FLASH interact directly and are present on the chromatin of RDH genes.
a, b, Western blot analyses of immunoprecipitates of endogenous CDK11 (a) and flag-tagged FLASH (F-FLASH) (b) from HCT116 cells expressing F-FLASH. The blots were probed against proteins indicated on the side.
c, Correlation analyses of CDK11 and FLASH co-occupancy genome-wide (10 kb bins) (top panel) and on RDH genes (bottom panel). Spearman correlation coefficient between indicated ChIP-seq samples is shown and correlation strength is indicated by colour code. FLASH ChIP-seq from hTERT and U2OS cells.
d, Western blot analyses of FLASH and CDK11 protein levels in cell lysates used for the CDK11 and FLASH ChIP-qPCR experiments in Fig. 2e and Extended Data Fig. 2e, respectively. FUS is a loading control. Representative replicate is shown.
e, Endogenous FLASH ChIP-qPCR on indicated RDH genes or control intergenic region (Ir) in HCT116 cells treated either with control (CTRL) or FLASH siRNAs for 24 h. n=3 biologically independent experiments, error bars=SEM, *P<0.05, Student´s two-sided t-test.

