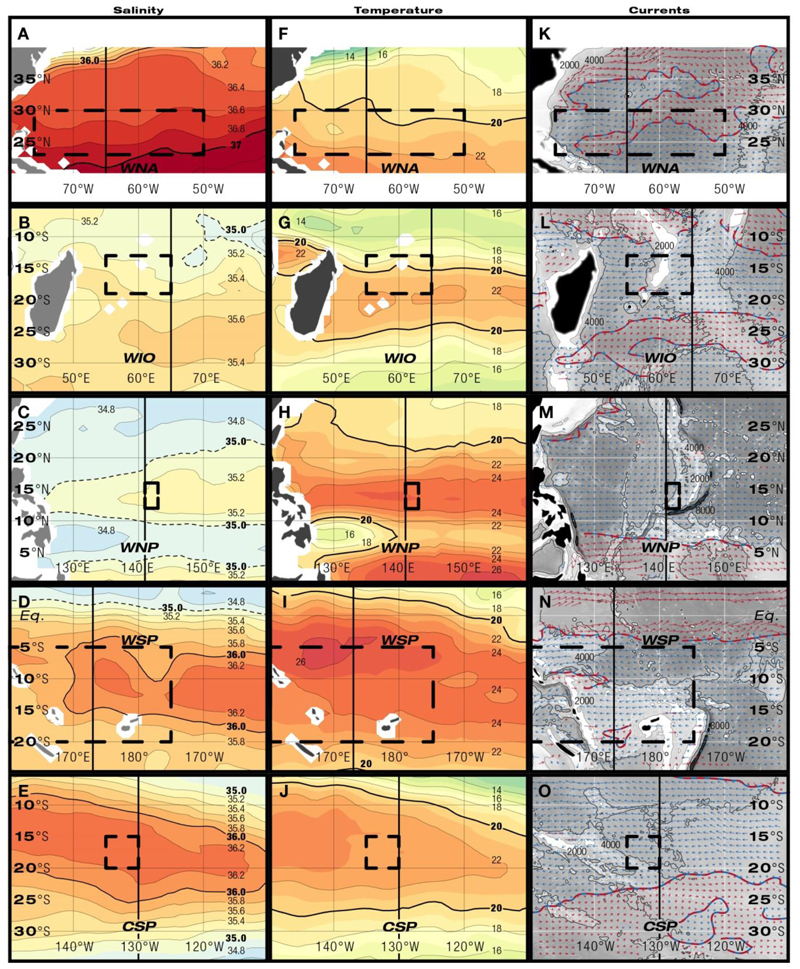
Fig. 4.
Maps of horizontal sections of salinity (A-E), temperature (°C, F-J), and geostrophic currents (U, m s-1, K-O, red: eastward currents, blue: westwards currents) at a depth of 150 m during known and presumed spawning times. Dashed rectangles indicate latitudinal and longitudinal extensions of spawning areas. Black vertical lines show the positions of meridional sections in Fig. 3.

