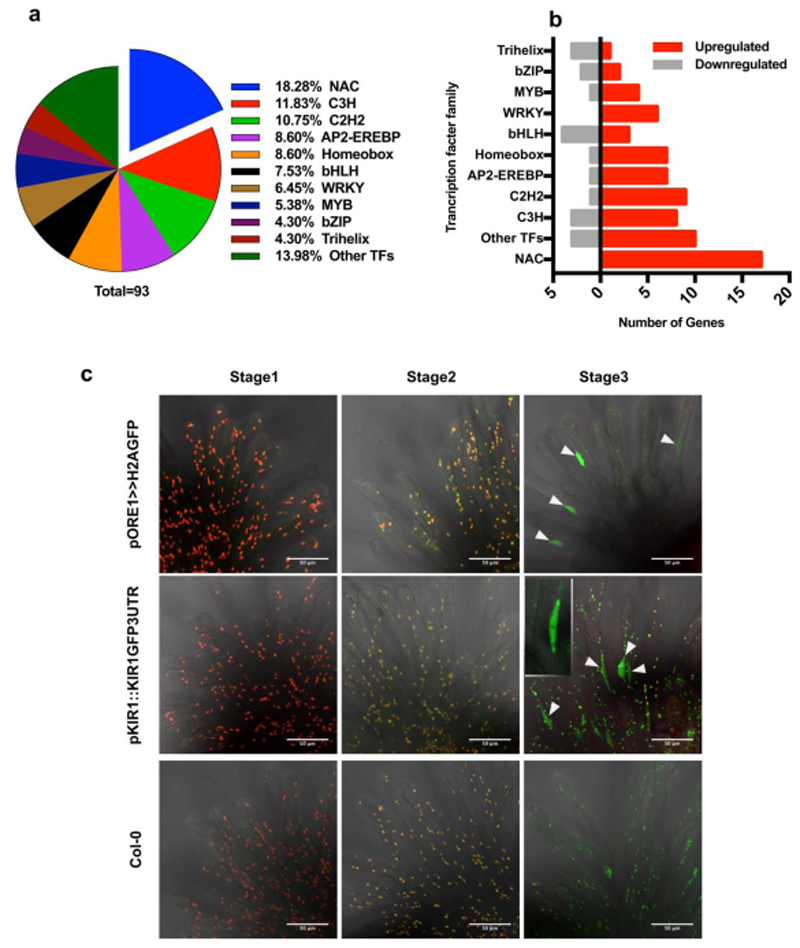
Figure 3. KIR1 and ORE1 are upregulated in senescent papilla cells.
a) Pie-chart showing the percentage of differentially expressed transcription factors of major families, with NAC family members representing the largest fraction. b) 17 NAC transcription factors are significantly upregulated during stigma senescence, more than members of other transcription factor families. c) Maximal projections of confocal microscopy images showing red plastid auto-fluorescence and green GFP fluorescence. Both the pORE1≫H2A-GFP transcriptional reporter and the pKIR1::KIR1-GFP-3’UTR translational reporter show a GFP signal in the fusiform papilla nuclei at stage 3 (arrowheads). The nucleus of a single papilla cell is shown in the inset. Note the change in the plastid auto-fluorescence spectrum from red over yellow to green during ageing, possibly caused by chlorophyll degradation. Scale bars, 50 µm.

