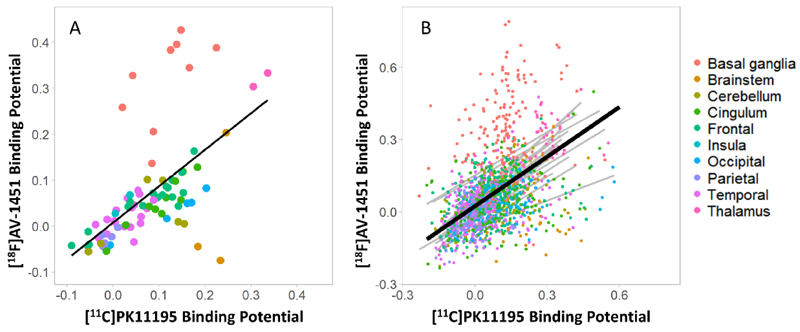
Figure 2.
Whole brain correlation between regional mean non-displaceable binding potential (BPND) of [11C]PK11195 and [18F]AV-1451 in the PSP group. Panels A: each point represents the average value across all patients for a specific brain region, while. Panel B: dots represent individual regional values for each patient, the black line represents the association between the two tracers at group level, while grey lines are individual correlations, within each patient. In both panels, colours indicate brain macro-areas reported on the right.

