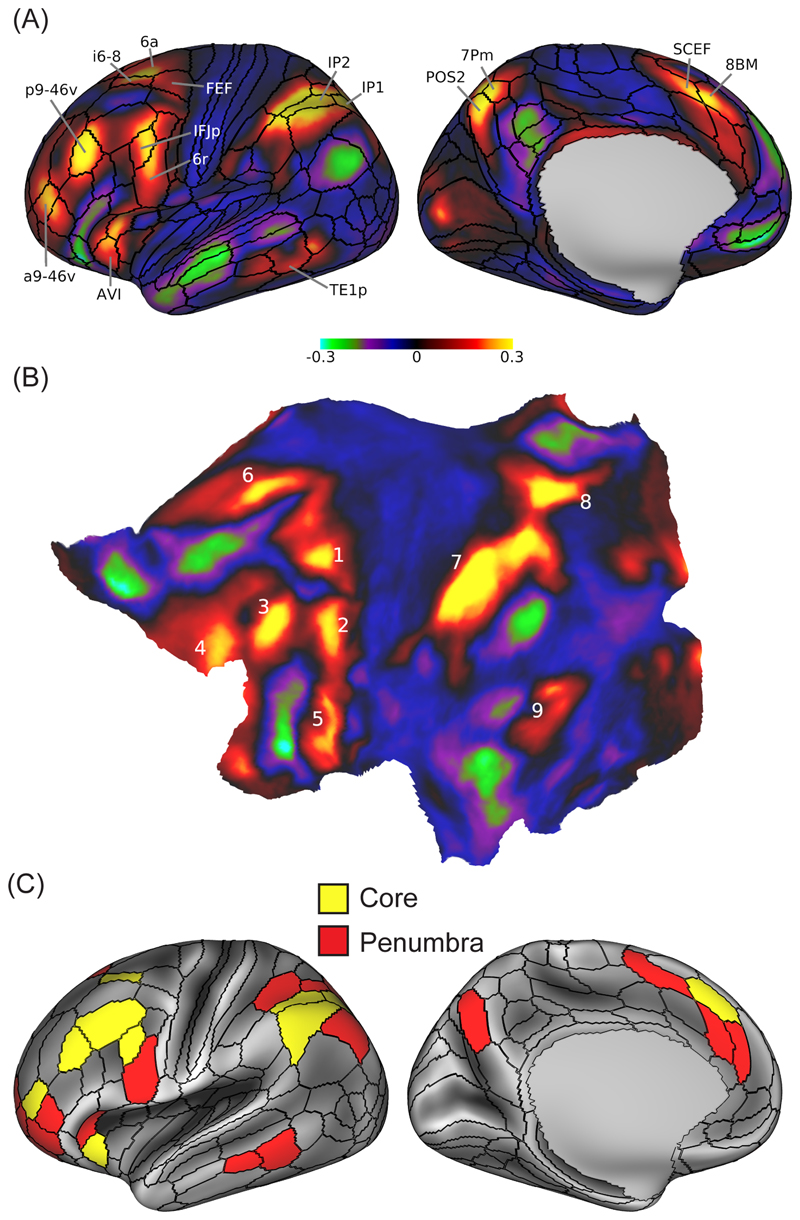
Figure 3. Anatomy and physiology of the MD system.
(A) Patches of cortical MD activity defined in data of 449 participants from the Human Connectome Project, using a conjunction of fMRI contrasts for working memory, reasoning and arithmetic. Left hemisphere data are shown; largely similar patches are also seen on the right. Regional parcellation (black outlines) and selected anatomical labels are taken from [45]. (B) The same data shown on a flat map of the left hemisphere. Numbering shows 9 MD patches distributed across lateral frontal (1-5), dorsomedial frontal (6), lateral (7) and medial (8) parietal, and temporo-occipital (9) cortex. (C) Individual MD regions using the HCP parcellation. Data are averaged from left and right hemispheres, and for illustration projected onto the left. The extended MD system (27 regions) is divided into core (10 regions, yellow), with activity above the mean of all 27 regions in at least 2/3 contrasts, and penumbra (remaining 17 regions, red). Adapted with permission from [44].

