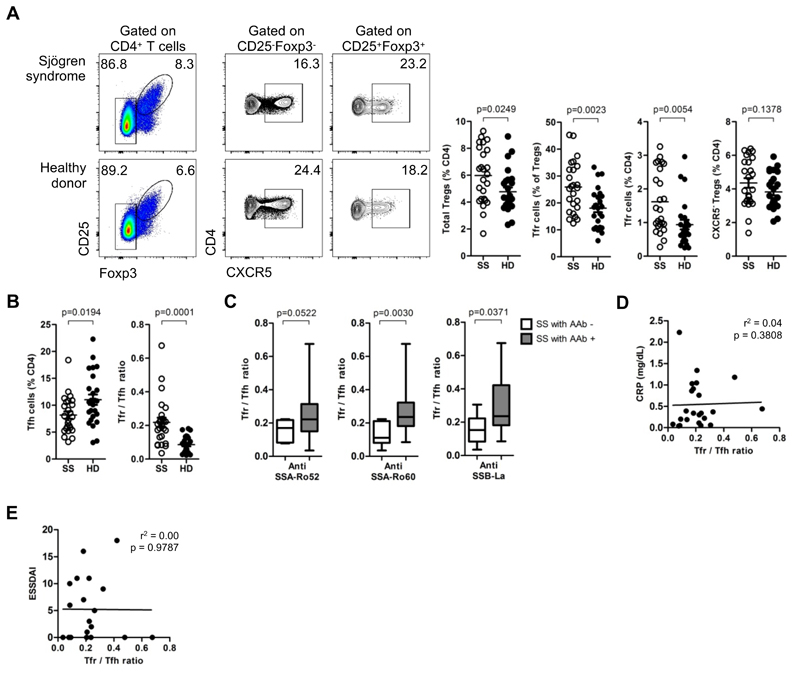
Figure 1. Blood Tfr cells are indicators of ongoing humoral activity.
(A) Frequency of total Tregs, Tfr cells and CXCR5- Tregs in peripheral blood of Sjögren syndrome patients (SS) and age-matched healthy donors (HD) (n = 25, unpaired Student T-test with Welch’s correction for variance). Representative plots (left) and pooled data (right). (B) Blood Tfr:Tfh ratio in SS patients and HD (n = 25, unpaired Student t-test with Welch’s correction for variance). (C) Blood Tfr:Tfh ratio in SS patients with and without serum autoantibodies (anti-SSA/Ro52, anti-SSB/Ro60, and anti-SSB/La) (n = 25, unpaired Student t-test). (D) Variation of blood Tfr:Tfh ratio accordingly to c-reactive protein (CRP). Analysis by linear regression. (E) Variation of blood Tfr:Tfh ratio accordingly to disease severity score (ESSDAI). Analysis by linear regression. Bars represent SEM (a,c) or minimum and maximum values (in box and whiskers graphs) (c).

