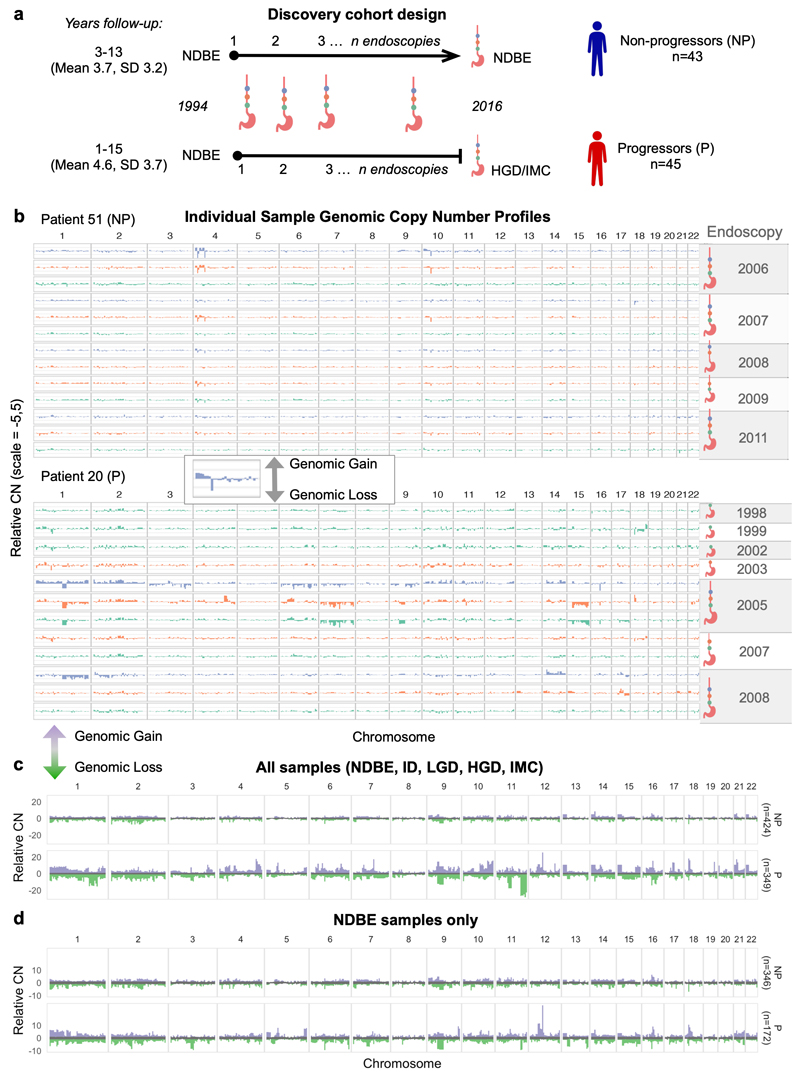
Figure 1. Copy number profiles in Barrett’s Esophagous vary over space and time.
a. Shows the case-control cohort design for the discovery patient cohort (n=88). Non-progressor patients had a minimum follow-up of 3 years, progressor patients had a minimum one year follow-up and all patients start at NDBE. Archival samples were collected from every available endoscopy over time, and along the length of the BE segment. b-d Bar plots showing the adjusted CN values across the genome in 5Mb windows, with relative (within each sample) gains shown in the positive y-axis, and relative losses shown in the negative y-axis. b. Genomic CN profiles of individual samples for a progressor patient (P, top) and a non-progressor patient (NP, bottom). The colors across the chromosomes in each sample are based on the location relative to the stomach it was taken in the esophagus (sample nearest to the esophageal-gastric junction at the bottom, up the BE segment) and the ideograms to the right of the plots show the samples that belong to a single endoscopy indicated by the year. Note the variability in the CN profiles within samples from the progressor patient in chromosomes 14 and 17 in contrast to the shared pattern across the non-progressor patient in those regions. c-d, distribution of relative CN values at each genomic segment across all samples in the progressor and non-progressor patient groups. The grey in the middle is the median ± 1SD, indicating a likely diploid genome value. Purple and green show the range of relative gains and losses, respectively. In c all samples regardless of pathology are plotted and a large variation in the CN between progressor and non-progressor patients is clear (i.e. chromosomes 1, 4, 9, 11). In d only NDBE samples from both patient groups are plotted and the progressor patients still show a much larger CN signal despite being pathologically indistinguishable.

