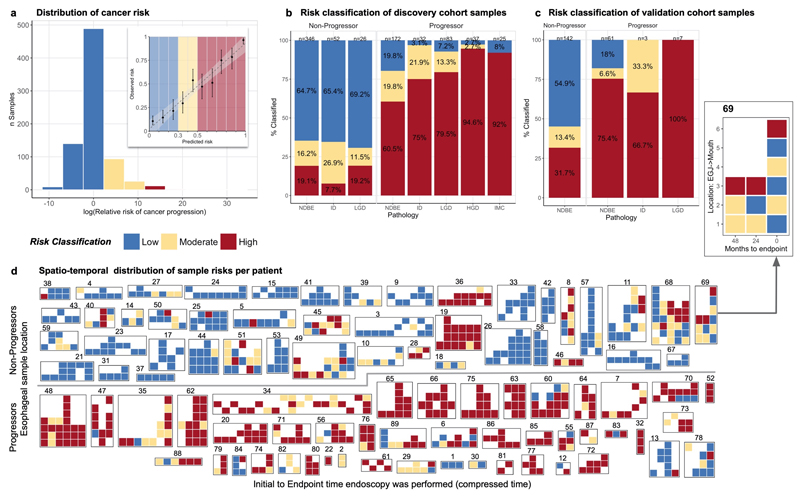
Figure 2. Genomic predictions of Barrett’s esophagus progression.
a. Histogram of the relative risk (RR) of cancer progression across the cohort based on the leave-one-patient out predictions. The highest RR is more than 30x greater risk of progression (dark reds) while the lowest RR is at a 10x lower risk (dark blues). Inset: shows the calibration of the predicted (x-axis) and observed (y-axis) probability of progression, evaluated in deciles. The ‘low’ (blue) and ‘high’ (red) risks are enriched for non-progressor and progressor patients respectively. b. Sample risk classifications in the discovery cohort of 88 patients (n=773 samples) plotted per pathology (e.g. NDBE, ID, LGD, HGD, IMC). These show that our model is able to predict progression before pathological changes are visible in NDBE samples and that c. these predictions are consistent in the independent validation cohort of 76 patients (n=213 samples). d. Illustration of risk classes across all samples in the discovery cohort (n=773). The row above the line shows progressor patients, while the row below the line are non-progressor patients. Each group of tiles denotes samples from a single patient, indicated by patient number above. On the x-axis endoscopies are plotted from the baseline on the left, to the final available endoscopy on the right. The y-axis indicates the relative location of the sample starting from the esophageal-gastric junction at the bottom up the length of the BE segment. The pop-out patient 69 shows example axis labels, all heatmaps include axis labels and pathology are included in Supplementary Figure 11.

