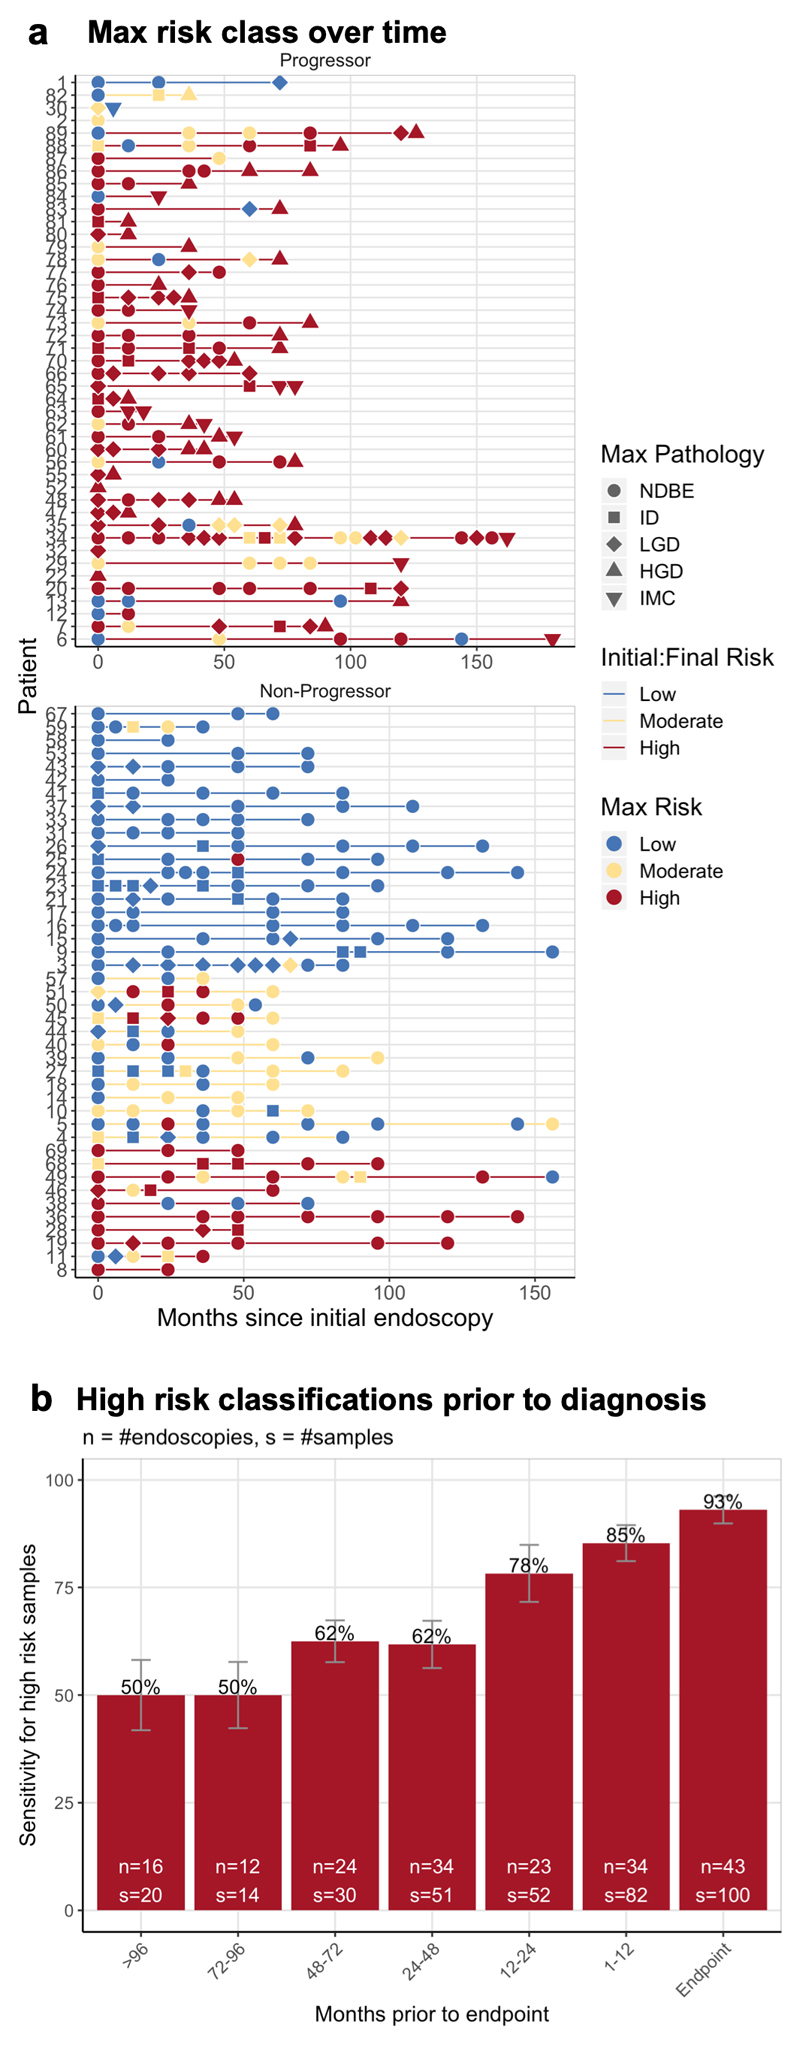
Figure 3. Cancer risk over time.
a. Per-endoscopy mean aggregated risks plotted per-patient (y-axis) over time (x-axis) in the months since the initial endoscopy. The top plot shows patients who progressed, and we see that in most patients we consistently classified their samples as ‘high’ risk, similarly in the non-progressors we consistently predict the a low-risk group. The interesting patients are the non-progressors who have consistently been ‘high’ risk. Follow-up continues on these patients and it is possible that they may ultimately progress to HGD/IMC. b. Looks at only the progressive patients and shows that CN can identify 50% of high risk patients more than 8 years prior to HGD or cancer.

