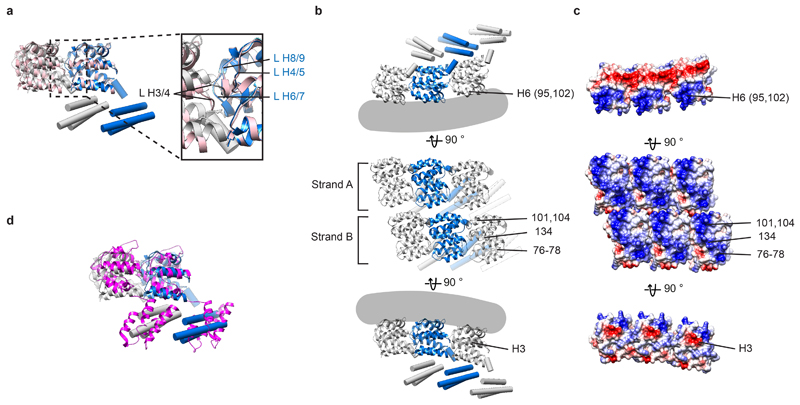
Extended Data Figure 3. Analysis of the M1 structure determined within virions and VLPs.
a) Overlay of the model of M1 subunits as they are arranged in virions and VLPs with two neighboring M1 NTD domains (pink) within the crystal packing in PDB:1EA3 13. Inset highlights the positions of the inter-helix loops (L). b) Model of M1 subunits as they are arranged in virions and VLPs, shown in three different orientations (as in Fig. 2b.) c) Surface charge representation for the NTD in equivalent orientations to those shown in a), colored from negative (red) to positive (blue). Charged residues that form inter-strand interfaces, and their respective helix numbers, are marked in upper and lower panels. Basic residues shown in Fig. 2c and involved in membrane interaction are marked in the middle panel. Mutation of residues 77 and 78 to Alanine reduces M1 incorporation into virions 63. d) Overlay of the M1 model with two neighboring infectious salmon anemia virus (ISAV) matrix proteins (magenta) from the crystal packing in PDB:5WCO 15. The difference in orientation of the CTD could reflect differences in IAV or ISAV virion morphology, but we consider it more likely that it reflects the sequence divergence between ISAV and IAV.

