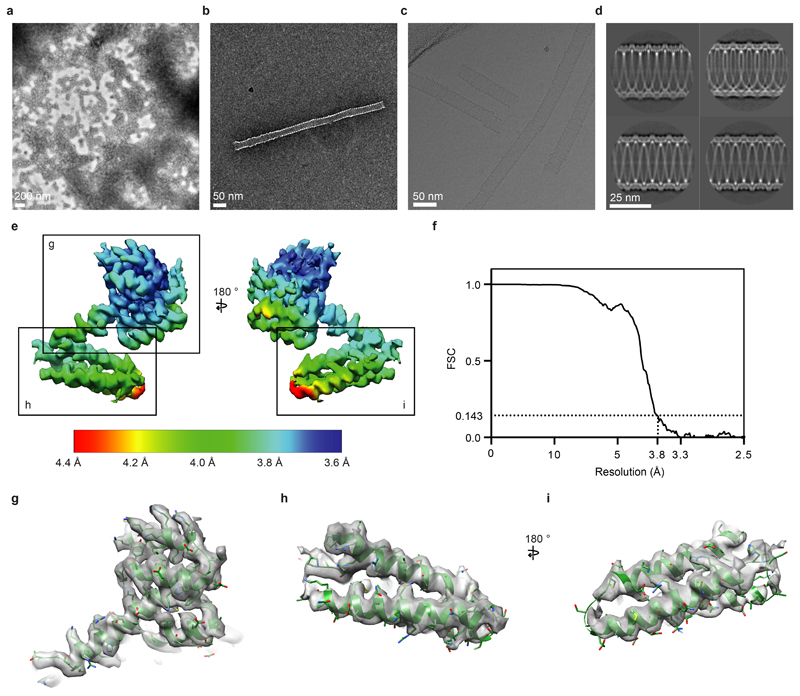
Extended Data Figure 5. Electron microscopy of in vitro reconstituted M1 helical tubes.
a) Negative-stain image of aggregated M1 tubes found within the pellet after sucrose cushion centrifugation. b) Negative-stain image of an in vitro assembled M1 tube in the presence of nucleic acid. Images in a and b are representative of at least five independent preparations. c) A typical cryo-EM image of in vitro assembled M1 tubes at 2.7 µm underfocus, representative of three independent preparations. d) Selected class averages with tube diameter between 327-329 Å as determined by segclassexam. The lower left class average has minimal out-of-plane tilt and was used to test possible helical parameters by segclassreconstruct. e) Cryo-EM density of an M1 monomer is shown, the surface is colored by local resolution of the map as determined by RELION. Boxes indicate regions magnified in g)-i). f) Global FSC curve of the final in vitro assembled M1 tube helical reconstruction (Fig. 2d). g-i) Magnified regions of cryo-EM density as indicated in e) and their fitted molecular models.

