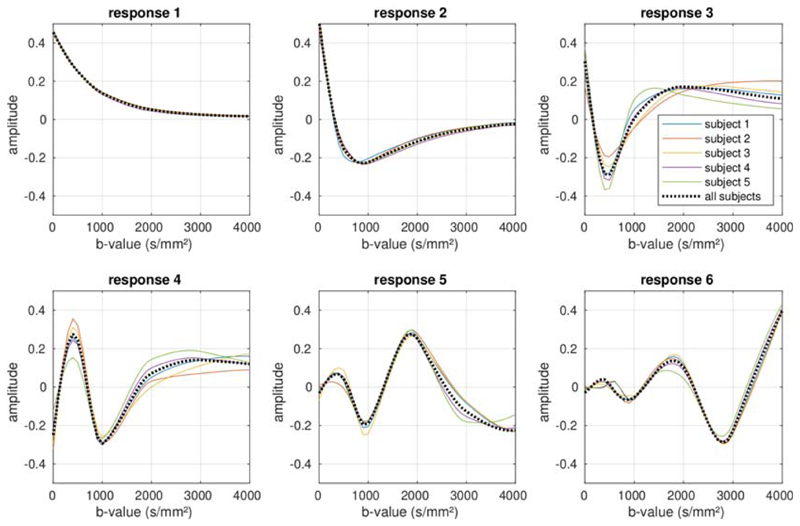
Figure 4.
The basis functions observed in the data, for all five subjects included in the study. The basis functions estimated from each subject when analysed independently are shown by the solid coloured lines, and show a high degree of consistency across subjects. The dotted black line shows the basis functions estimated from the combined data across all subjects. The basis functions can be seen to represent increasingly rapid oscillations in the b-value dependence, with the first component corresponding to the mean signal across the data. See Table 2 for the corresponding effect sizes

